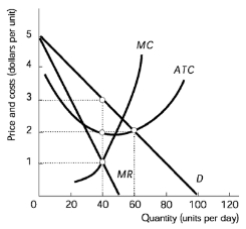
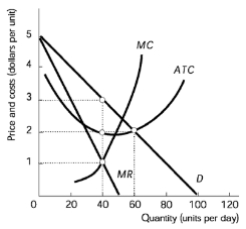
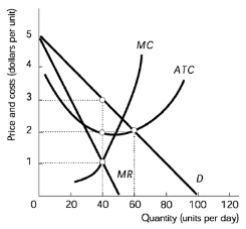
Alright, so now let's go ahead and calculate profit using the graph in monopolistic competition. Quick note, this lesson is exactly the same as when we study the monopoly market structure, okay? When we study calculating profit, I took the page, it's the same exact page that's going to be in that packet, so if you did it already, this should seem very familiar and if not, well, good luck. Once you get there, you're going to see that it's exactly alright? So profit maximizing quantity, well, we saw this even in perfect competition, it's the same. We always want to produce where marginal revenue equals marginal cost, okay? That's going to be our profit maximizing quantity and when we say profit maximizing, well, we also mean loss minimizing. Okay? Loss minimizing. So if you're in a situation where you're losing money, well this is the way to lose the least amount of money, okay? So it's still important in those cases. Alright, so here on the graph, right here in the center of the screen, this is something very common that you'll see when studying monopolistic competition is a graph like this that shows our marginal revenue and our marginal cost. We're going to have a separate demand curve from marginal revenue, right? We saw that marginal revenue is always going to be less than the demand and that is going to be our profit maximizing quantity.
Okay? So that's going to be right here where marginal revenue and marginal cost are crossing and this would be our quantity that we would want to produce right here. Some quantity right there.
Okay, so that would be our profit maximizing quantity. Now that we know how to find that, let's calculate profit or loss on the graph. Okay. So here's our formula, the same one that we used in perfect competition, right? Price−Average Total Cost, well, that's our profit per unit, right? Price minus average total cost and then we multiply it by the number of units that we sell, right? We sell it at a certain price, it costs us a certain amount on average, that's going to be the amount of profit we get from that unit times all the units.
Cool? So that gets us to our total profit and then we're going to have the same two steps here, okay? But they're going to be a little different than in perfect competition because we've got a separate marginal revenue curve from our demand curve. Okay? So let's check out these steps. First, we're going to find our profit maximizing quantity, marginal revenue equals marginal cost, and then we are going to find price and average total cost, right? We need price and average total cost here for our profit formula, so we're going to need to look those up on the graph at our profit maximizing quantity. Okay, so let's go ahead and start here on the left graph.
So this left graph, it's very similar to the one we did above where we found our profit maximizing quantity. All I've added here is an average total cost curve now, alright? So we've got that average total cost which we're going to need to calculate profit. So let's go ahead and find first our profit maximizing quantity, so go ahead and mark where marginal revenue equals marginal cost on this left graph here. So I'll give you a second. Where's marginal revenue equal marginal cost? Alright. Well, it's right here right where the red lines are intersecting, that's our marginal revenue and our marginal cost right there, so that is going to be our profit maximizing quantity right there. That is the quantity we want to produce. If we had some numbers, we would know what that quantity is, we would have a number for it, right? So now, let's go ahead and calculate our profit.
Alright, now that we know the quantity, now at this quantity, we need to know what the price is and what the average total cost is, okay? So we've got the quantity, let's go up to our demand curve, right? Our price is going to be on our demand curve, so I'm going to go up here to find our demand curve and that's going to be our price. Price at this quantity, right? And what about our average total cost? Well, we got to go to our average total cost curve at this quantity and it's below the point right here. There's our average total cost. So this would be the average total cost at that profit maximizing quantity and then our profit, well, it's going to be the box in between those two. Okay. So we're going to see is we're going to have this box right here is going to be our profit. Right? And it's profit because that average total cost is less than the price, right? The average total cost is below the price, so we've got profit here. Okay, and it's everything inside that box, So we would have to calculate the area of this box and that would tell us what the profit is. Okay. I'm going to write it in here. Profit and let's label our graph. This graph here is showing a profit. Okay? On the left, we've got a graph showing a loss, okay? So let me get out of the way here and let's calculate this loss. So let's minimize the loss as well, right? The reason we have a loss, notice how high that average total cost curve is, right? It's way higher than it was in the other case and it's above the demand curve, so we can imagine there's going to be a higher average total cost than the price, but let's go ahead and minimize that cost. So let's first find where marginal revenue equals marginal cost.
So that is going to be this point right here and that is our quantity. In this case, our loss minimizing quantity. Okay. Right there that is the quantity. So at that quantity we need to find the price and the average total cost. Okay, so let's go ahead and go up and down till we find those. Those, so from we'll go up from here and we will find our price, so this will be our price right here, And what's our average total cost? Well, we got to keep going up from here to get to our average total cost curve, and we're gonna get an average total cost right here. So notice the average total cost is higher than our price, right? So we have a loss and the loss is going to be this amount, right? For all the units we produce all the way to there, that is our loss. Okay. And this is the loss minimizing quantity. That's the smallest that the loss can get. If we produce at any other quantity, we would have a bigger area of that rectangle.
Alright, so that's how we calculate profit and loss and you'll see that it was pretty similar to perfect competition, right, where we're still looking for marginal revenue equals marginal cost. The only difference there was that the marginal revenue curve was our demand curve as well and then we find our price and average total cost. Cool? Alright. Let's go ahead and do some practice before we move on to the next topic. Cool. Let's do it now.


