13. Liquids, Solids & Intermolecular Forces
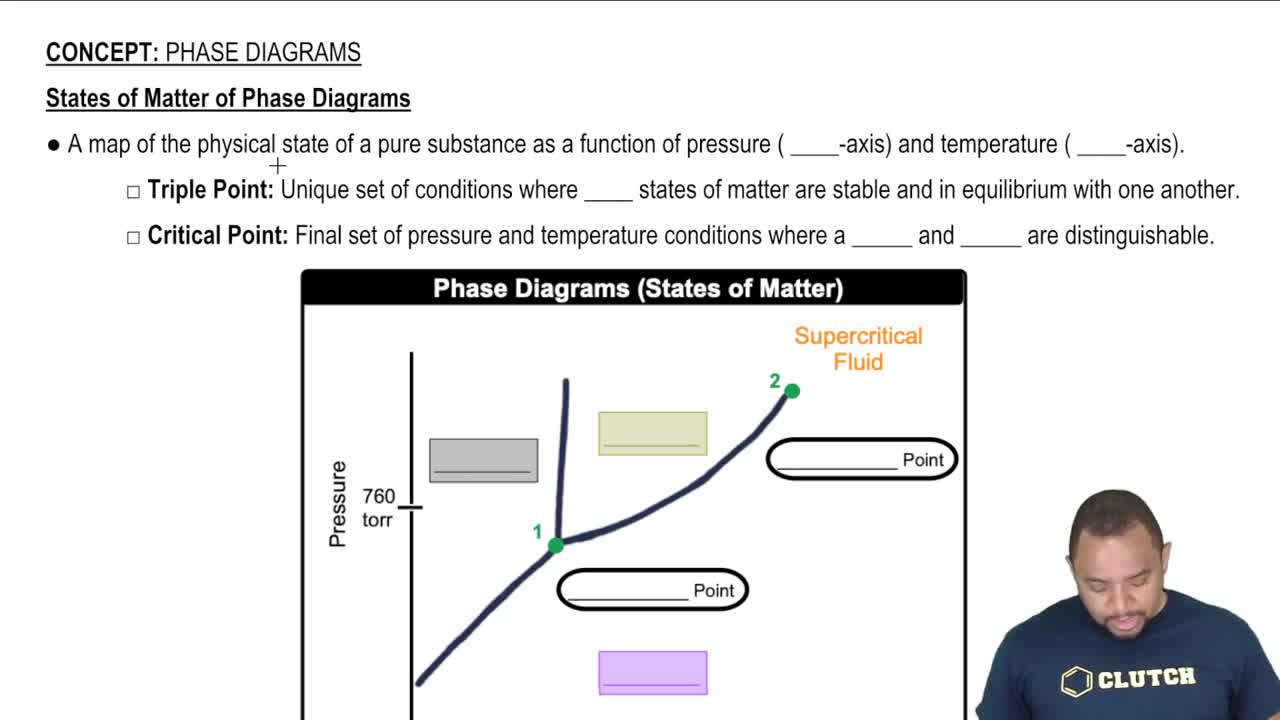
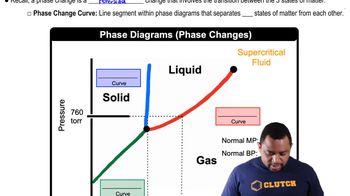
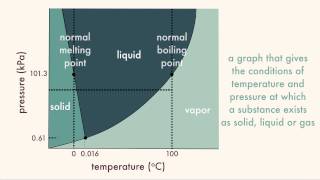
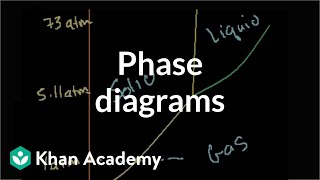
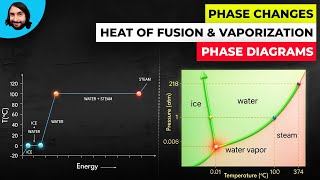
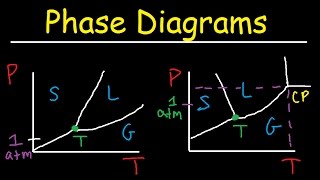
Phase Diagrams
13. Liquids, Solids & Intermolecular Forces
Phase Diagrams
 03:19
03:19


Additional 5 creators.
Learn with other creators


Showing 8 of 8 videos
Practice this topic
- Multiple Choice
The critical point of this substance occurs at what temperature?
1823views13rank - Multiple Choice
Arrow I corresponds to:
1587views4rank1comments - Multiple Choice
What is the normal freezing point of this unknown substance?
2900views8rank - Multiple Choice
At what temperature can we no longer tell the difference between the liquid and gas phases?
1615views10rank1comments - Open Question
Based on the phase diagram shown below, how will the melting point of the substance change if the pressure is increased above 1 atm?
1302views - Open Question
In the phase diagram for water, indicate the direction that the solid–liquid and liquid–gas coexistence lines will move along the temperature axis after the addition of solute.
1237views - Open Question
A gaseous substance turns directly into a solid. Which term describes this change?
1104views - Open Question
The boiling temperature and its relationship to the system exist in the ____.
1087views