Textbook Question
FIGURE EX2.8 showed the velocity graph of blood in the aorta. What is the blood's acceleration during each phase of the motion, speeding up and slowing down?
1231
views

 Verified step by step guidance
 7:27
7:27 05:47
05:47 14:03
14:03FIGURE EX2.8 showed the velocity graph of blood in the aorta. What is the blood's acceleration during each phase of the motion, speeding up and slowing down?
What constant acceleration, in SI units, must a car have to go from zero to 60 mph in 10 s?
FIGURE EX2.12 shows the velocity-versus-time graph for a particle moving along the x-axis. Its initial position is at x0 = 2 m at t0 = 0 s. What are the particle's position, velocity, and acceleration at t = 1.0 s?
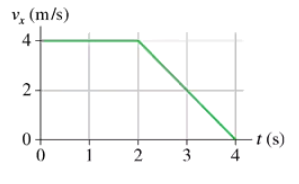
FIGURE EX2.9 shows the velocity graph of a particle. Draw the particle's acceleration graph for the interval 0 s ≤ t ≤ 4 s.
A jet plane is cruising at 300 m/s when suddenly the pilot turns the engines up to full throttle. After traveling 4.0 km, the jet is moving with a speed of 400 m/s. What is the magnitude of the jet's acceleration, assuming it to be a constant acceleration?
How far has the car traveled when it reaches 60 mph? Give your answer both in SI units and in feet.