
Textbook Question
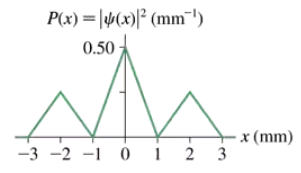
FIGURE EX39.16 shows the wave function of an electron. Draw a graph of |ψ(x)|2.
62
views

 Verified step by step guidance
 8:13
8:13
 06:24
06:24 06:23
06:23FIGURE EX39.16 shows the wave function of an electron. Draw a graph of |ψ(x)|2.
FIGURE EX39.14 is a graph of |ψ(x)|2 for an electron. What is the probability that the electron is located between x = 1.0 nm and x = 2.0 nm?
When 5×10¹² photons pass through an experimental apparatus, 2.0×10⁹ land in a 0.10-mm-wide strip. What is the probability density at this point?
In one experiment, 2000 photons are detected in a 0.10-mm-wide strip where the amplitude of the electromagnetic wave is 10 V/m. How many photons are detected in a nearby 0.10-mm-wide strip where the amplitude is 30 V/m?
FIGURE EX39.14 is a graph of |ψ(x)|2 for an electron. What is the value of a?
FIGURE EX39.12 shows the probability density for an electron that has passed through an experimental apparatus. If 1.0×10⁶ electrons are used, what is the expected number that will land in a 0.010-mm-wide strip at 2.000 mm?