Ch 02: Kinematics in One Dimension
Knight Calc - Physics for Scientists and Engineers 5th Edition
Knight Calc5th EditionPhysics for Scientists and EngineersISBN: 9780137344796Not the one you use?Change textbook
Chapter 2, Problem 38a

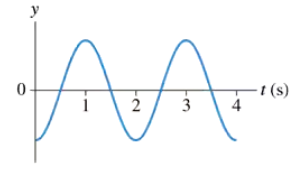
A block is suspended from a spring, pulled down, and released. The block's position-versus-time graph is shown in FIGURE P2.38. At what times is the velocity zero? At what times is the velocity most positive? Most negative?

Verified step by step guidance
1
Analyze the graph: The position-versus-time graph shows the block's displacement (x) as a function of time (t). Velocity is the slope of the position-time graph at any given point.
Identify times when the velocity is zero: Velocity is zero when the slope of the graph is flat (horizontal). From the graph, this occurs at t = 4 seconds and t = 8 seconds.
Determine times when the velocity is most positive: Velocity is most positive when the slope of the graph is steepest and positive. From the graph, this occurs between t = 0 and t = 2 seconds, with the steepest slope at t = 2 seconds.
Determine times when the velocity is most negative: Velocity is most negative when the slope of the graph is steepest and negative. From the graph, this occurs between t = 8 seconds and t = 10 seconds, with the steepest slope at t = 10 seconds.
Summarize findings: The velocity is zero at t = 4 seconds and t = 8 seconds, most positive at t = 2 seconds, and most negative at t = 10 seconds. These observations are based on the slopes of the graph at these points.

Verified video answer for a similar problem:

This video solution was recommended by our tutors as helpful for the problem above.
Video duration:
8m
Was this helpful?

Key Concepts

Here are the essential concepts you must grasp in order to answer the question correctly.

Position-Time Graph

A position-time graph illustrates the position of an object over time. The slope of the graph at any point indicates the object's velocity. A horizontal line indicates zero velocity, while a positive slope indicates positive velocity and a negative slope indicates negative velocity. Understanding how to interpret these slopes is crucial for analyzing motion.
Recommended video:
Guided course
03:04
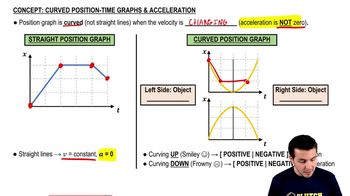
Curved Position-Time Graphs & Acceleration

Velocity

Velocity is the rate of change of position with respect to time and is a vector quantity, meaning it has both magnitude and direction. It can be calculated as the slope of the position-time graph. When the graph is flat, the velocity is zero; when the graph slopes upwards, the velocity is positive, and when it slopes downwards, the velocity is negative.
Recommended video:
Guided course
7:27
Escape Velocity

Equilibrium and Oscillation

In the context of a spring system, equilibrium refers to the position where the forces acting on the block are balanced. When the block is pulled down and released, it oscillates around this equilibrium position. The analysis of the position-time graph helps identify the points in time when the block is at rest (velocity zero) and when it is moving fastest in either direction.
Recommended video:
Guided course
10:13
Torque & Equilibrium