Ch 02: Motion Along a Straight Line

Chapter 2, Problem 2

A physics professor leaves her house and walks along the sidewalk toward campus. After 5 min it starts to rain, and she returns home. Her distance from her house as a function of time is shown in Fig. E2.10. At which of the labeled points is her velocity (b) constant and positive?

Verified Solution
Video duration:
3m
This video solution was recommended by our tutors as helpful for the problem above.
833
views
Was this helpful?

Video transcript

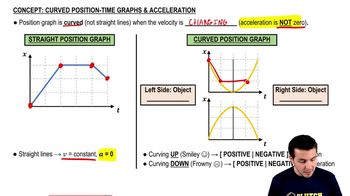
Hey everybody. So today we're dealing with the problem regarding a position versus time graph. Now we're being told that an office messenger leaves a waiting area to deliver a parcel to his client. Now the office Messenger reaches the client's place after 12 minutes and returns back to the waiting area. The messengers distances plotted in the graph below. As we see it is a position versus time graph. And we're being asked to determine which points represent both constant and positive velocity. So let's dive into this a little deeper. Right. So very important to note is that on a position versus time graph on a position versus time graph the slope, right? If we want to find the slope, we would take the change in the y direction of the graph divided by the change in the X direction of the graph. So in that case it would be the change in the uh position over the change in time. And what does this mean? Well, change in position over change in time is the definition of velocity velocity, which means the slope at any given point on a position versus time graph is equal to the velocity at that specific point. With that in mind. Let's go ahead and delve a little further. So what we need to note is that constant velocity, constant velocity means that we have a straight line constant. Let's try this in blue. Let's write this in blue constant velocity means we have a street line. Because when the slope of a line is straight, that means it is the same at each point going up, which means the velocity in this case would be constant. If we're looking for a positive velocity, positive velocity, positive positive velocity, then the sign must be positive, right? It needs to be an upper trend. The velocity needs to be a positive value, not just in magnitude, but in actuality of its value itself. And that means that the slope must also be a positive slope. It must be going in the upwards direction, it must be going upwards. So with that knowledge, we can actually rule out three of the points on the graph. Right away, points D. E and F can all be ruled out because D has a velocity of zero because the slope is zero, which means it's neither positive nor negative. And points E N F r downwards, they have a negative slope, which means they cannot fit our criteria. Now looking further, if we want constant velocity between choices A B and C, we can actually rule out and to choice A why? Because it is a curve. It's parabolic in nature, which means it cannot be constant. It is changing at each point along the curve. However, on points B and C. B is a straight line and see as a straight line and both B and C are positive in direction. Therefore the points that represent constant and positive velocity on this graph on this position versus time graph, I should say our points B and C or answer choice D Oops answer choice D. I hope this helps, and I look forward to seeing you all in the next one.
Related Practice
Textbook Question
An astronaut has left the International Space Station to test a new space scooter. Her partner measures the following velocity changes, each taking place in a 10-s interval. What are the magnitude, the algebraic sign, and the direction of the average acceleration in each interval? Assume that the positive direction is to the right. (a) At the beginning of the interval, the astronaut is moving toward the right along the x-axis at 15.0 m/s, and at the end of the interval she is moving toward the right at 5.0 m/s. (b) At the beginning she is moving toward the left at 5.0 m/s, and at the end she is moving toward the left at 15.0 m/s. (c) At the beginning she is moving toward the right at 15.0 m/s, and at the end she is moving toward the left at 15.0 m/s.
784
views
Textbook Question
At launch a rocket ship weighs 4.5 million pounds. When it is launched from rest, it takes 8.00 s to reach 161 km/h; at the end of the first 1.00 min, its speed is 1610 km/h. (a) What is the average acceleration (in m/s2) of the rocket (i) during the first 8.00 s and (ii) between 8.00 s and the end of the first 1.00 min?
786
views
Textbook Question
A physics professor leaves her house and walks along the sidewalk toward campus. After 5 min it starts to rain, and she returns home. Her distance from her house as a function of time is shown in Fig. E2.10. At which of the labeled points is her velocity (a) zero?

503
views
Textbook Question
A physics professor leaves her house and walks along the sidewalk toward campus. After 5 min it starts to rain, and she returns home. Her distance from her house as a function of time is shown in Fig. E2.10. At which of the labeled points is her velocity (c) constant and negative?

474
views
Textbook Question
A physics professor leaves her house and walks along the sidewalk toward campus. After 5 min it starts to rain, and she returns home. Her distance from her house as a function of time is shown in Fig. E2.10. At which of the labeled points is her velocity (e) decreasing in magnitude?

453
views
Textbook Question
A ball moves in a straight line (the x-axis). The graph in Fig. E2.9 shows this ball's velocity as a function of time. (a) What are the ball's average speed and average velocity during the first 3.0 s?

3048
views
2
rank