Ch 02: Motion Along a Straight Line

Chapter 2, Problem 2

A physics professor leaves her house and walks along the sidewalk toward campus. After 5 min it starts to rain, and she returns home. Her distance from her house as a function of time is shown in Fig. E2.10. At which of the labeled points is her velocity (e) decreasing in magnitude?

Verified Solution
Video duration:
4m
This video solution was recommended by our tutors as helpful for the problem above.
453
views
Was this helpful?

Video transcript

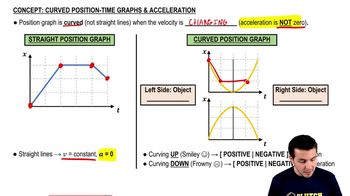
Hey everyone. So today we're being told a little story, there's a person who goes to a company and is very confident that he'll be able to find out this interview location at the company himself Over a 16 minute period. He realizes that he cannot find this point and goes back to the entrance. Eight minutes later his path to travel. His position has been or his distance from the entrance has been graphed as a function of time in the graph below. With this we're being asked to find out which points represent philosophy with decreasing magnitude. Now we can recall that on a position versus time graph if we want to find slope, well, that will be the change in the Y direction over. The change in X. Y over change in X, which the X direction is position or sorry, the y direction is position and the X direction is time, which is nothing but the definition of velocity. Therefore velocity is the slope of a position versus time graph. Now, what does this mean? Well, for decreasing magnitude well decreasing and increasing magnitude means accelerated motion and changing velocity will have a parabolic shape. Right? And velocity is changing on a velocity versus time graph for example, it will be I'm sorry if velocity is changing though, that means the slope on a position versus time graph must not be straight line. It must be constantly changing. And you'll see why I'm drawing this out in just a second. But to do this. Well, there are four different types of parabolas that we can find right have drawn them out here. The two left circles represent decreasing magnitude of velocity. The slope starts either increasing or it starts and goes in a positive direction. It goes in the negative direction but it starts at one point and plateaus out and becomes flat, it becomes zero, so it goes from a value and becomes zero. Conversely the two on the right start at a sort of flat point and then either increase or decrease. And this is again, these are all position versus time graphs, which means that the velocity here is positive velocity, here is negative and so on and so forth. This is negative velocity, this is positive velocity. So we're looking for decreasing magnitude. The two on the right. These two are increasing, The two on the left are decreasing. So that in mind back to our graph or back to our charter graph, the only two points that represent decreasing magnitude are points A and points see point B is flat, which means the velocity is constant. There it is. Or rather it is zero point D E F and G. I'll represent increasing magnitude so thus or let me cross that out. Actually not to confuse us. They all represent increasing magnitude which means answer choice, uh answer choice D which cites A. N. C. As our point of decreasing magnitude is correct. I hope this helps. And I look forward to seeing you all in the next one
Related Practice
Textbook Question
A physics professor leaves her house and walks along the sidewalk toward campus. After 5 min it starts to rain, and she returns home. Her distance from her house as a function of time is shown in Fig. E2.10. At which of the labeled points is her velocity (a) zero?

503
views
Textbook Question
A physics professor leaves her house and walks along the sidewalk toward campus. After 5 min it starts to rain, and she returns home. Her distance from her house as a function of time is shown in Fig. E2.10. At which of the labeled points is her velocity (b) constant and positive?

833
views
Textbook Question
A physics professor leaves her house and walks along the sidewalk toward campus. After 5 min it starts to rain, and she returns home. Her distance from her house as a function of time is shown in Fig. E2.10. At which of the labeled points is her velocity (c) constant and negative?

474
views
Textbook Question
A ball moves in a straight line (the x-axis). The graph in Fig. E2.9 shows this ball's velocity as a function of time. (a) What are the ball's average speed and average velocity during the first 3.0 s?

3048
views
2
rank
Textbook Question
A cat walks in a straight line, which we shall call the x-axis, with the positive direction to the right. As an observant physicist, you make measurements of this cat's motion and construct a graph of the feline's velocity as a function of time (Fig. E2.30). (a) Find the cat's velocity at t = 4.0 s and at t = 7.0 s.

1691
views
Textbook Question
A cat walks in a straight line, which we shall call the x-axis, with the positive direction to the right. As an observant physicist, you make measurements of this cat's motion and construct a graph of the feline's velocity as a function of time (Fig. E2.30). (b) What is the cat's acceleration at t = 3.0 s? At t = 6.0 s? At t = 7.0 s?

989
views