Ch 02: Motion Along a Straight Line
Chapter 2, Problem 2

A cat walks in a straight line, which we shall call the x-axis, with the positive direction to the right. As an observant physicist, you make measurements of this cat's motion and construct a graph of the feline's velocity as a function of time (Fig. E2.30). (b) What is the cat's acceleration at t = 3.0 s? At t = 6.0 s? At t = 7.0 s? Velocity-time graph showing a cat's motion with a linear increase in velocity over time.

Verified step by step guidance
1
Identify the slope of the velocity vs. time graph, as the slope represents the acceleration.
Determine the change in velocity (Δv) over the change in time (Δt) for the given time intervals.
For t = 3.0 s, find the slope of the graph at this point by calculating Δv/Δt.
For t = 6.0 s, find the slope of the graph at this point by calculating Δv/Δt.
For t = 7.0 s, find the slope of the graph at this point by calculating Δv/Δt.

Verified Solution

Video duration:
3m
This video solution was recommended by our tutors as helpful for the problem above.
Was this helpful?

Key Concepts

Here are the essential concepts you must grasp in order to answer the question correctly.

Velocity

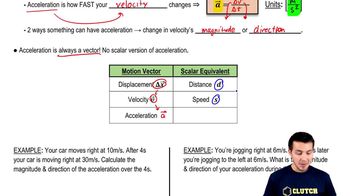
Velocity is a vector quantity that describes the rate of change of an object's position with respect to time. It has both magnitude and direction, typically expressed in meters per second (m/s). In the context of the question, the velocity of the cat is represented on the y-axis of the graph, indicating how fast and in which direction the cat is moving along the x-axis.
Recommended video:
Guided course
7:27
Escape Velocity

Acceleration

Acceleration is the rate of change of velocity over time, measured in meters per second squared (m/s²). It indicates how quickly an object is speeding up or slowing down. In the given scenario, the acceleration can be determined from the slope of the velocity-time graph; a constant slope indicates uniform acceleration, while a changing slope would indicate varying acceleration.
Recommended video:
Guided course
05:47
Intro to Acceleration

Slope of a Graph

The slope of a graph represents the relationship between two variables. In a velocity-time graph, the slope corresponds to acceleration. A positive slope indicates that the object is accelerating, while a negative slope indicates deceleration. The steeper the slope, the greater the acceleration. In this case, the linear increase in the velocity graph suggests a constant positive acceleration for the cat.
Recommended video:
Related Practice
Textbook Question
A physics professor leaves her house and walks along the sidewalk toward campus. After 5 min it starts to rain, and she returns home. Her distance from her house as a function of time is shown in Fig. E2.10. At which of the labeled points is her velocity (e) decreasing in magnitude?

491
views
Textbook Question
A ball moves in a straight line (the x-axis). The graph in Fig. E2.9 shows this ball's velocity as a function of time. (a) What are the ball's average speed and average velocity during the first 3.0 s?

3240
views
2
rank
Textbook Question
A cat walks in a straight line, which we shall call the x-axis, with the positive direction to the right. As an observant physicist, you make measurements of this cat's motion and construct a graph of the feline's velocity as a function of time (Fig. E2.30). (a) Find the cat's velocity at t = 4.0 s and at t = 7.0 s.

1831
views
Textbook Question
A cat walks in a straight line, which we shall call the x-axis, with the positive direction to the right. As an observant physicist, you make measurements of this cat's motion and construct a graph of the feline's velocity as a function of time (Fig. E2.30). (c) What distance does the cat move during the first 4.5 s? From t = 0 to t = 7.5 s?

891
views
Textbook Question
A cat walks in a straight line, which we shall call the x-axis, with the positive direction to the right. As an observant physicist, you make measurements of this cat's motion and construct a graph of the feline's velocity as a function of time (Fig. E2.30). (d) Assuming that the cat started at the origin, sketch clear graphs of the cat's acceleration and position as functions of time.

1505
views
Textbook Question
The Fastest (and Most Expensive) Car! The table shows test data for the Bugatti Veyron Super Sport, the fastest street car made. The car is moving in a straight line (the x-axis). (a) Sketch a vx–t graph of this car's velocity (in mi/h) as a function of time. Is its acceleration constant? (b) Calculate the car's average acceleration (in m/s2) between (i) 0 and 2.1 s; (ii) 2.1 s and 20.0 s; (iii) 20.0 s and 53 s. Are these results consistent with your graph in part (a)? (Before you decide to buy this car, it might be helpful to know that only 300 will be built, it runs out of gas in 12 minutes at top speed, and it costs more than $1.5 million!)

791
views