Here are the essential concepts you must grasp in order to answer the question correctly.
Ideal Gas Law
The Ideal Gas Law describes the relationship between pressure (P), volume (V), temperature (T), and the number of moles (n) of a gas, expressed as PV = nRT. This law assumes ideal behavior, where gas particles do not interact and occupy no volume. Understanding this law is crucial for analyzing gas behavior during thermodynamic processes.
Recommended video:
Ideal Gases and the Ideal Gas Law
Thermodynamic Processes
A thermodynamic process refers to the transition of a system from one state to another, characterized by changes in pressure, volume, and temperature. Common types include isothermal (constant temperature), adiabatic (no heat exchange), and isobaric (constant pressure) processes. Identifying the type of process helps in applying the correct equations and principles to solve related problems.
Recommended video:
Properties of Cyclic Thermodynamic Processes
Pressure-Volume Graphs
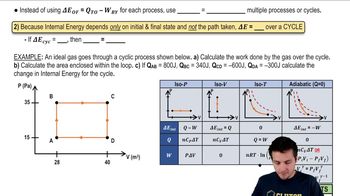
Pressure-volume (P-V) graphs visually represent the relationship between the pressure and volume of a gas during a thermodynamic process. The shape of the curve indicates the type of process occurring; for example, a hyperbolic curve suggests an isothermal process. Analyzing these graphs is essential for understanding how gases behave under different conditions and for calculating work done during the process.
Recommended video:
Pressure and Atmospheric Pressure


