Ch.6 - Electronic Structure of Atoms
Chapter 6, Problem 8b

Consider a fictitious one-dimensional system with one electron. The wave function for the electron, drawn below, is c1x2 = sin x from x = 0 to x = 2p. (b) At what value or values of x will there be the greatest probability of finding the electron?
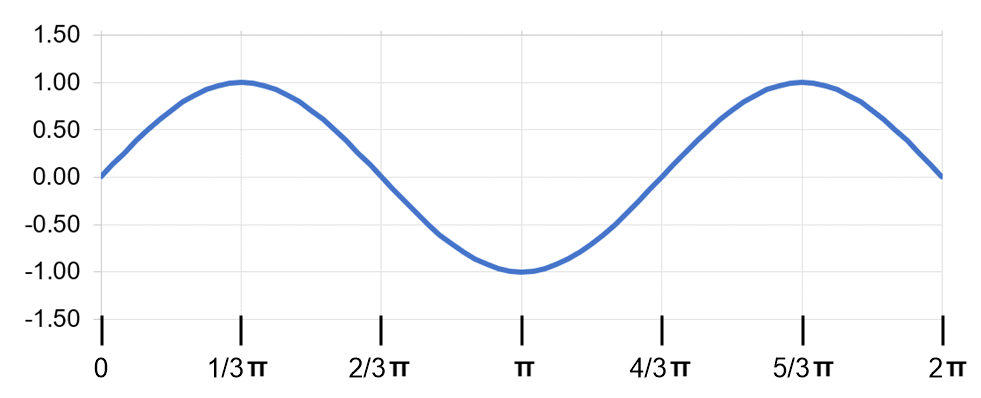
Graph of the wave function sin(x) for an electron from 0 to 2π, showing peaks and nodes.

Verified Solution

Video duration:
3m
This video solution was recommended by our tutors as helpful for the problem above.
Was this helpful?

Key Concepts

Here are the essential concepts you must grasp in order to answer the question correctly.

Wave Function

The wave function is a mathematical description of the quantum state of a system, representing the probability amplitude of finding a particle in a given position. In this case, the wave function is given as sin(x), which describes the behavior of the electron in a one-dimensional system. The square of the wave function's magnitude gives the probability density, indicating where the electron is likely to be found.
Recommended video:
Guided course
03:37
Logarithmic Functions

Probability Density

Probability density is derived from the wave function and indicates the likelihood of finding a particle in a specific region of space. For a wave function ψ(x), the probability density is given by |ψ(x)|². In the context of the provided wave function sin(x), the peaks of the graph correspond to higher probabilities of locating the electron, while the nodes (where the function crosses zero) indicate positions where the electron cannot be found.
Recommended video:
Guided course
01:56
Density Concepts

Nodes and Antinodes

In wave mechanics, nodes are points where the wave function is zero, resulting in zero probability of finding the particle, while antinodes are points where the wave function reaches its maximum value, indicating the highest probability of finding the particle. In the graph of sin(x), the peaks represent antinodes, where the electron is most likely to be found, while the points where the function crosses the x-axis are nodes, indicating locations of zero probability.
Recommended video:
Guided course
01:04
Radial and Angular Nodes
Related Practice
Textbook Question

The familiar phenomenon of a rainbow results from the diffraction of sunlight through raindrops. (a) Does the wavelength of light increase or decrease as we proceed outward from the innermost band of the rainbow?

338
views
Textbook Question

A certain quantum-mechanical system has the energy levels shown in the accompanying diagram. The energy levels are indexed by a single quantum number n that is an integer. (b) Which quantum numbers are involved in the transition that requires the least energy?

589
views
Textbook Question

Consider the three electronic transitions in a hydrogen atom shown here, labeled A, B, and C. (a) Three electromagnetic waves, all drawn on the same scale, are also shown. Each corresponds to one of the transitions. Which electromagnetic wave (i), (ii), or (iii), is associated with electronic transition C?

1396
views
2
rank
Textbook Question

The contour representation of one of the orbitals for the n = 3 shell of a hydrogen atom is shown here. (a) What is the quantum number l for this orbital?

447
views
Textbook Question

The contour representation of one of the orbitals for the n = 3 shell of a hydrogen atom is shown here. (c) In which of the following ways would you modify this sketch if the value of the magnetic quantum number, ml, were to change? (i) It would be drawn larger, (ii) the number of lobes would change, (iii) the lobes of the orbital would point in a different direction, (iv) there would be no change in the sketch.

209
views
Textbook Question

The accompanying drawing shows a contour plot for a dyz orbital. Consider the quantum numbers that could potentially correspond to this orbital. (b) What is the value of the angular momentum quantum number, l?

487
views