Textbook Question
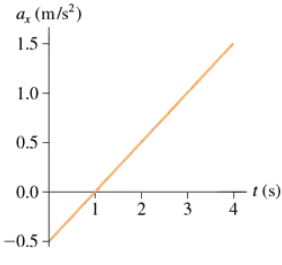
A single force with x-component Fₓ acts on a 2.0 kg object as it moves along the x-axis. A graph of Fₓ versus t is shown in FIGURE P5.32. Draw an acceleration graph aₓ versus t) for this object.
2003
views

 Verified step by step guidance
 06:54
06:54 05:47
05:47 05:59
05:59A single force with x-component Fₓ acts on a 2.0 kg object as it moves along the x-axis. A graph of Fₓ versus t is shown in FIGURE P5.32. Draw an acceleration graph aₓ versus t) for this object.
A constant force is applied to an object, causing the object to accelerate at 10 m/s². What will the acceleration be if The force is halved and the object's mass is doubled?
Exercises 23, 24, 25, 26, and 27 describe a situation. For each, identify all forces acting on the object and draw a free-body diagram of the object. An ice hockey puck glides across frictionless ice.
Exercises 23, 24, 25, 26, and 27 describe a situation. For each, identify all forces acting on the object and draw a free-body diagram of the object. Your physics textbook is sliding across the table.
A constant force is applied to an object, causing the object to accelerate at 10 m/s². What will the acceleration be if the force is halved?
Newton's First Law Exercises 17, 18, and 19 show two of the three forces acting on an object in equilibrium. Redraw the diagram, showing all three forces. Label the third force F3.