Textbook Question
A particle moving along the x-axis has its position described by the function x = (2t3 + 2t + 1) m, where t is in s. At t = 2s, what are the particle's position?
2244
views

 Verified step by step guidance
 05:47
05:47 05:33
05:33 11:43
11:43A particle moving along the x-axis has its position described by the function x = (2t3 + 2t + 1) m, where t is in s. At t = 2s, what are the particle's position?
The vertical position of a particle is given by the function y = (t2 - 4t + 2) m, where t is in s. What is the particle's position at that time?
A bicycle coasting at 8.0 m/s comes to a 5.0-m-long, 1.0-m-high ramp. What is the bicycle's speed as it leaves the top of the ramp?
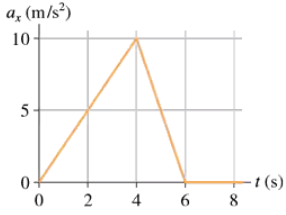
FIGURE EX2.31 shows the acceleration-versus-time graph of a particle moving along the x-axis. Its initial velocity is v0x = 8.0 m/s at t0 = 0 s. What is the particle’s velocity at t = 4.0s?
A particle moving along the x-axis has its veocity described by the function vx = 2t2 m/s, where t is in s. itsinitial position is x0 = 1 m at t0 = 0 s. At t = 1 s, what are the particle's position?
A snowboarder glides down a 50-m-long, 15° hill. She then glides horizontally for 10 m before reaching a 25° upward slope. Assume the snow is frictionless. How far can she travel up the 25° slope?