Textbook Question
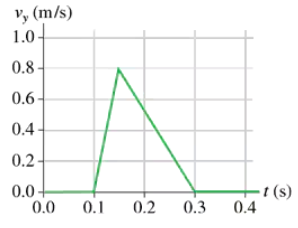
FIGURE EX2.5 shows the position graph of a particle. Draw the particle’s velocity graph for the interval .
543
views

 Verified step by step guidance
 05:59
05:59 04:05
04:05 07:46
07:46FIGURE EX2.5 shows the position graph of a particle. Draw the particle’s velocity graph for the interval .
A particle starts from at and moves with the velocity graph shown in FIGURE EX2.6. Does this particle have a turning point? If so, at what time?
A particle starts from x0 = 10 m at t0 = 0 s and moves with the velocity graph shown in FIGURE EX2.6. What is the object’s position at t = 2 s and 4 s?
FIGURE EX2.9 shows the velocity graph of a particle. Draw the particle's acceleration graph for the interval 0 s ≤ t ≤ 4 s.
FIGURE EX2.8 showed the velocity graph of blood in the aorta. What is the blood's acceleration during each phase of the motion, speeding up and slowing down?
FIGURE EX2.12 shows the velocity-versus-time graph for a particle moving along the x-axis. Its initial position is at x0 = 2 m at t0 = 0 s. What are the particle's position, velocity, and acceleration at t = 1.0 s?