Here are the essential concepts you must grasp in order to answer the question correctly.
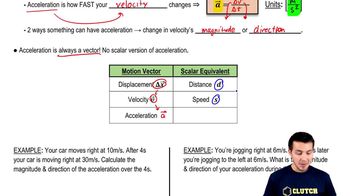
Velocity
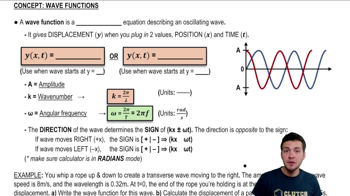
Velocity is a vector quantity that describes the rate of change of an object's position with respect to time. It has both magnitude and direction, typically expressed in meters per second (m/s). In the context of the velocity-versus-time graph, the slope of the graph indicates the object's acceleration, while the value of the velocity at a specific time indicates how fast and in which direction the object is moving.
Recommended video:
Acceleration
Acceleration is the rate of change of velocity over time, measured in meters per second squared (m/s²). It can be determined from the slope of a velocity-time graph; a positive slope indicates increasing velocity (acceleration), while a negative slope indicates decreasing velocity (deceleration). Understanding acceleration is crucial for analyzing how the particle's speed changes as it moves along the x-axis.
Recommended video:
Position Function
The position function describes an object's location at any given time and is derived from the velocity function. By integrating the velocity over time, one can determine the position of the particle at any moment. In this case, knowing the initial position and the velocity at a specific time allows us to calculate the particle's position at t = 3.0s, providing a complete picture of its motion.
Recommended video:

 Verified step by step guidance
 7:27
7:27