2. 1D Motion / Kinematics
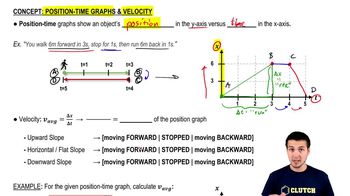
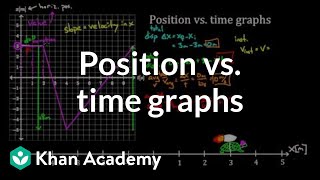
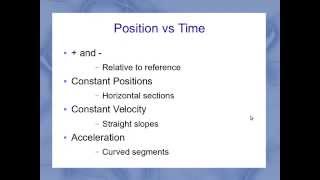
Position-Time Graphs & Velocity
 07:41
07:41

Learn with other creators


Practice this topic
- Multiple Choice
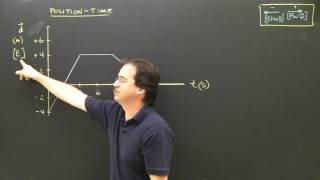
The position-time graph for a moving box is shown below.
(a) What is the box's average velocity from 0 to 5s?
(b)What is the box's average velocity from 0 to 8s?
(c) What is the box's velocity in the interval where it's moving fastest?3722views88rank1comments - Multiple Choice
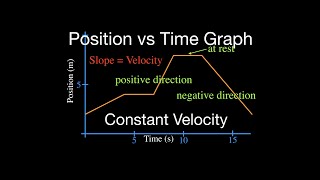
The position-time graph for a ball on a track is shown below.
(a) What is the ball's velocity at 4s?
(b) At what time(s) is the ball approximately travelling at -10m/s?
(c) From t = 3 to 7s, what is the sign of the acceleration?
3228views78rank2comments - Multiple ChoiceWhich motion diagram best represents the following event: a skier skis down a slope with constant speed?828views
- Textbook Question
A cat walks in a straight line, which we shall call the -axis, with the positive direction to the right. As an observant physicist, you make measurements of this cat's motion and construct a graph of the feline's velocity as a function of time (Fig. E). Assuming that the cat started at the origin, sketch clear graphs of the cat's acceleration and position as functions of time.
2358views - Textbook Question
A cat walks in a straight line, which we shall call the -axis, with the positive direction to the right. As an observant physicist, you make measurements of this cat's motion and construct a graph of the feline's velocity as a function of time (Fig. E). Find the cat's velocity at s and at s.
2562views - Textbook Question
A physics professor leaves her house and walks along the sidewalk toward campus. After min, it starts to rain, and she returns home. Her distance from her house as a function of time is shown in Fig. E. At which of the labeled points is her velocity decreasing in magnitude?
908views - Textbook Question
A physics professor leaves her house and walks along the sidewalk toward campus. After min, it starts to rain, and she returns home. Her distance from her house as a function of time is shown in Fig. E. At which of the labeled points is her velocity constant and negative?
926views - Multiple Choice
In a position-time graph, what is represented on the -axis?
470views