2. 1D Motion / Kinematics
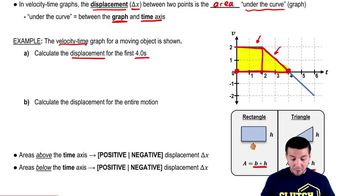
Calculating Displacement from Velocity-Time Graphs
 04:43
04:43
Learn with other creators


Practice this topic
- Multiple Choice
A moving box's motion is described by the velocity graph below. The box's initial position is x = 0.
(a) How far has the box moved at t = 4?
(b) What is the displacement of the box from t=4 to t=10?2050views26rank4comments - Textbook Question
FIGURE EX2.8 is a somewhat idealized graph of the velocity of blood in the ascending aorta during one beat of the heart. Approximately how far, in cm, does the blood move during one beat?
1543views - Textbook Question
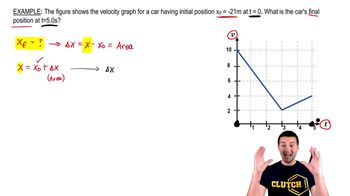
A particle starts from x0 = 10 m at t0 = 0 s and moves with the velocity graph shown in FIGURE EX2.6. What is the object’s position at t = 2 s and 4 s?
808views - Textbook Question
Given v(t) = 25 + 18t, where v is in m/s and t is in s, use calculus to determine the total displacement from t1 = 1.3 s to t2 = 3.6 s.
1062views - Multiple Choice
Which scenario best describes an object with a (displacement of zero) when analyzing its motion on a velocity-time graph?
28views - Multiple Choice
An object moves with a constant velocity of for . What is the total displacement of the object after seconds?
31views - Multiple Choice
A particle moves along a straight line with its velocity as a function of time shown in the graph below. What is the net displacement of the particle between seconds and seconds? (Assume the area under the velocity-time graph between these times is .)
29views