Here are the essential concepts you must grasp in order to answer the question correctly.
Vapor Pressure
Vapor pressure is the pressure exerted by a vapor in equilibrium with its liquid or solid phase at a given temperature. It reflects the tendency of molecules to escape from the liquid phase into the vapor phase. Higher temperatures generally increase vapor pressure, as more molecules have sufficient energy to overcome intermolecular forces and enter the vapor state.
Recommended video:
Raoult's Law and Vapor Pressure
Clausius-Clapeyron Equation
The Clausius-Clapeyron equation describes the relationship between vapor pressure and temperature for a substance. It can be expressed as ln(P) = -ΔH_vap/(R*T) + C, where ΔH_vap is the enthalpy of vaporization, R is the gas constant, and T is the temperature in Kelvin. This equation is essential for plotting ln(P) versus 1/T, allowing for the determination of ΔH_vap from the slope of the resulting line.
Recommended video:
Clausius-Clapeyron Equation
Graphing Relationships
Graphing relationships between variables, such as vapor pressure versus temperature and ln(vapor pressure) versus 1/temperature, helps visualize and analyze data. The first graph typically shows a nonlinear relationship, while the second graph, based on the Clausius-Clapeyron equation, should yield a linear plot. Understanding how to interpret these graphs is crucial for deriving thermodynamic properties from experimental data.
Recommended video:
Frequency-Wavelength Relationship

 This video solution was recommended by our tutors as helpful for the problem above.
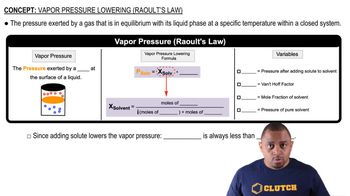
 02:40
02:40
