Ch.11 - Liquids & Phase Changes
Chapter 11, Problem 31
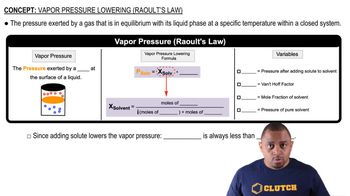
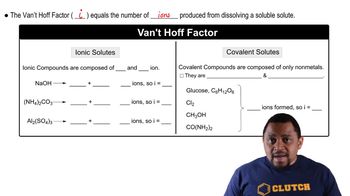
The following diagram shows a close-up view of part of the vapor-pressure curves for a solvent (red curve) and a solution of the solvent with a second liquid (green curve). Is the second liquid more volatile or less volatile than the solvent?
Verified Solution
Video duration:
2mThis video solution was recommended by our tutors as helpful for the problem above.
538
views
Was this helpful?
Video transcript
Related Practice
Textbook Question
Assume that you have a sample of gas at 350 K in a sealed
container, as represented in (a). Which of the drawings
(b)–(d) represents the gas after the temperature is lowered
from 350 K to 150 K? The boiling point of the gas is 90 K.
524
views
Textbook Question
What is the vapor pressure of SiCl4 in mm Hg at 30.0 °C? (See Problem 11.27.)
720
views
Textbook Question
Dichloromethane, CH2Cl2, is an organic solvent used for removing caffeine from coffee beans. The following table gives the vapor pressure of dichloromethane at various tem- peratures. Fill in the rest of the table, and use the data to plot curves of Pvap versus T and ln Pvap versus 1/T.
699
views
Textbook Question
The following phase diagram shows part of the liquid–vapor phase-transition boundaries for two solutions of equal con- centration, one containing a nonvolatile solute and the other containing a volatile solute whose vapor pressure at a given temperature is approximately half that of the pure solvent. (d) Based on your drawing, what is the approximate normal boiling point of the pure solvent?
679
views
Textbook Question
Choose any two temperatures and corresponding vapor pressures in the table given in Problem 11.30, and use those values to calculate ΔHvap for dichloromethane in kJ/mol. How does the value you calculated compare to the value you read from your plot in Problem 11.32?
674
views
Textbook Question
The dipole moment of methanol is m = 1.70 D. Use arrows
to indicate the direction in which electrons are displaced.
1522
views