Graph each function. See Examples 6–8.ƒ(x) = x² - 1
Verified step by step guidance
1
Identify the type of function: The given function \( f(x) = x^2 - 1 \) is a quadratic function, which is a type of polynomial function.
Determine the general shape: Quadratic functions are parabolas. Since the coefficient of \( x^2 \) is positive, the parabola opens upwards.
Find the vertex: The vertex form of a quadratic function is \( f(x) = a(x-h)^2 + k \). For \( f(x) = x^2 - 1 \), it can be rewritten as \( f(x) = (x-0)^2 - 1 \), so the vertex is at \( (0, -1) \).
Identify the axis of symmetry: The axis of symmetry for a parabola \( y = ax^2 + bx + c \) is given by \( x = -\frac{b}{2a} \). Here, \( b = 0 \), so the axis of symmetry is \( x = 0 \).
Plot key points: Calculate a few points on either side of the vertex to help sketch the graph. For example, evaluate \( f(x) \) at \( x = -1, 1, -2, \) and \( 2 \) to get additional points.
Verified video answer for a similar problem:
This video solution was recommended by our tutors as helpful for the problem above
Video duration:
4m
Play a video:
0 Comments
Key Concepts
Here are the essential concepts you must grasp in order to answer the question correctly.
Quadratic Functions
A quadratic function is a polynomial function of degree two, typically expressed in the form f(x) = ax² + bx + c. The graph of a quadratic function is a parabola, which can open upwards or downwards depending on the sign of the coefficient 'a'. Understanding the properties of parabolas, such as their vertex, axis of symmetry, and intercepts, is essential for graphing these functions accurately.
The vertex of a parabola is the highest or lowest point on the graph, depending on whether it opens downwards or upwards. For the function f(x) = x² - 1, the vertex can be found using the formula x = -b/(2a), where 'a' and 'b' are coefficients from the standard form. In this case, the vertex is at the point (0, -1), which is crucial for sketching the graph.
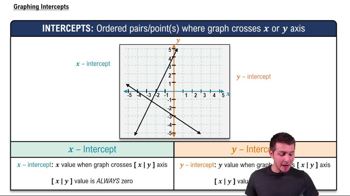
Intercepts are points where the graph of a function crosses the axes. The x-intercepts occur where f(x) = 0, and the y-intercept occurs where x = 0. For the function f(x) = x² - 1, the x-intercepts can be found by solving the equation x² - 1 = 0, resulting in x = ±1, while the y-intercept is at (0, -1). Identifying these intercepts helps in accurately plotting the graph.

 Verified step by step guidance
 6:36
6:36