In Exercises 59–74, convert each polar equation to a rectangular equation. Then use a rectangular coordinate system to graph the rectangular equation. r = 8
Verified step by step guidance
1
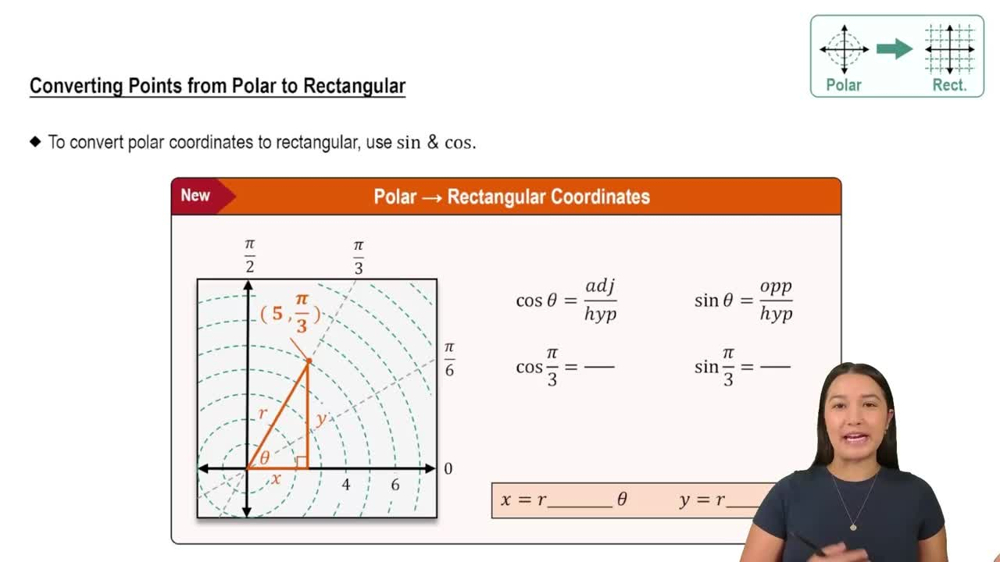
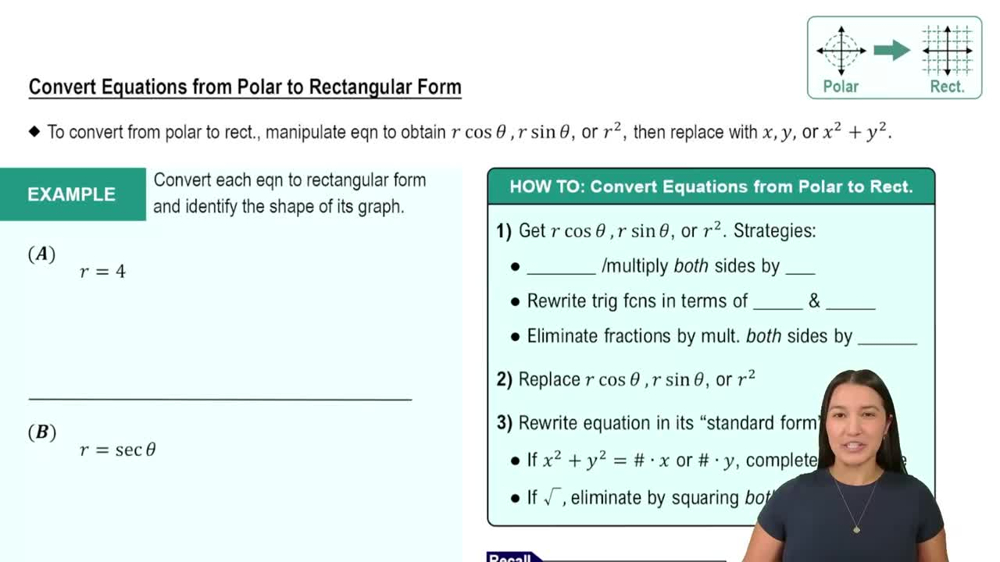
Recall the relationship between polar and rectangular coordinates: \(x = r \cos\theta\) and \(y = r \sin\theta\), and also \(r^2 = x^2 + y^2\).
Given the polar equation \(r = 8\), square both sides to express in terms of \(r^2\): \(r^2 = 8^2\) which simplifies to \(r^2 = 64\).
Substitute \(r^2\) with \(x^2 + y^2\) to convert the equation into rectangular form: \(x^2 + y^2 = 64\).
Recognize that the rectangular equation \(x^2 + y^2 = 64\) represents a circle centered at the origin with radius 8.
To graph the equation, draw a circle centered at the origin \((0,0)\) with radius 8 units on the rectangular coordinate system.
Verified video answer for a similar problem:
This video solution was recommended by our tutors as helpful for the problem above
Video duration:
1m
Play a video:
0 Comments
Key Concepts
Here are the essential concepts you must grasp in order to answer the question correctly.
Polar and Rectangular Coordinate Systems
Polar coordinates represent points using a radius and an angle (r, θ), while rectangular coordinates use x and y values. Understanding how these systems describe points in the plane is essential for converting equations between them.
Conversion Formulas Between Polar and Rectangular Coordinates
The key formulas for conversion are x = r cos θ and y = r sin θ, with r = √(x² + y²). These allow translating polar equations into rectangular form by substituting r and θ with expressions involving x and y.
Once the polar equation is converted, graphing involves plotting the rectangular equation on the Cartesian plane. Recognizing the shape (e.g., circle, line) from the rectangular form helps in accurately sketching the graph.

 Verified step by step guidance
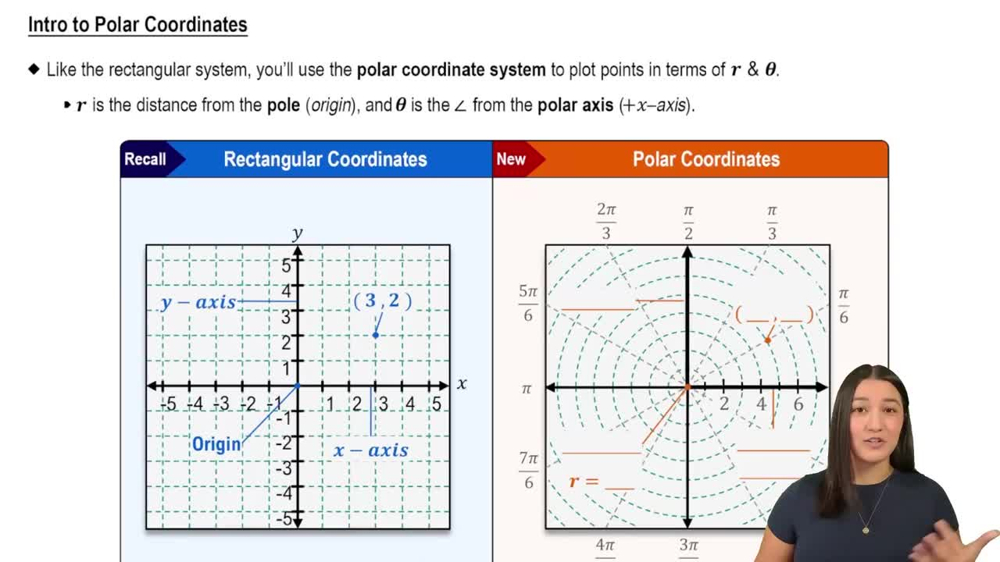
 05:32
05:32