Graph each function over a two-period interval. y = cos (x - π/2 )
Verified step by step guidance
1
Identify the basic form of the cosine function: \( y = \cos(x) \).
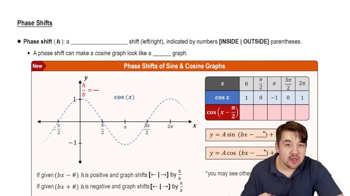
Recognize the phase shift in the function \( y = \cos(x - \pi/2) \). This indicates a horizontal shift to the right by \( \pi/2 \) units.
Determine the period of the cosine function, which is \( 2\pi \). Since we need to graph over a two-period interval, the interval will be \([0, 4\pi]\).
Plot the key points of the cosine function, starting from the phase shift: \( (\pi/2, 1), (\pi, 0), (3\pi/2, -1), (2\pi, 0), (5\pi/2, 1), (3\pi, 0), (7\pi/2, -1), (4\pi, 0) \).
Draw the smooth curve of the cosine function through these points, ensuring it completes two full cycles over the interval \([0, 4\pi]\).
Verified video answer for a similar problem:
This video solution was recommended by our tutors as helpful for the problem above
Play a video:
Was this helpful?
Key Concepts
Here are the essential concepts you must grasp in order to answer the question correctly.
Cosine Function
The cosine function is a fundamental trigonometric function defined as the ratio of the adjacent side to the hypotenuse in a right triangle. It is periodic with a period of 2π, meaning it repeats its values every 2π units. The graph of the cosine function oscillates between -1 and 1, with key points at multiples of π/2.
Phase shift refers to the horizontal translation of a periodic function along the x-axis. In the function y = cos(x - π/2), the term (x - π/2) indicates a phase shift to the right by π/2 units. This shift alters the starting point of the cosine wave, affecting where the peaks and troughs occur on the graph.
Graphing trigonometric functions involves plotting their values over a specified interval. For y = cos(x - π/2), one must consider the amplitude, period, and phase shift to accurately represent the function. The two-period interval means the graph should extend from 0 to 4π, capturing two complete cycles of the cosine wave.