Here are the essential concepts you must grasp in order to answer the question correctly.
Position vs. Time Graphs
A position vs. time graph illustrates how the position of an object changes over time. The slope of this graph at any point represents the object's velocity. A steeper slope indicates a higher velocity, while a flat slope indicates the object is at rest. Understanding this relationship is crucial for interpreting how position changes relate to velocity.
Recommended video:
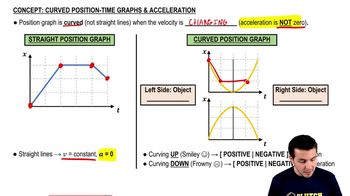
Curved Position-Time Graphs & Acceleration
Velocity
Velocity is a vector quantity that describes the rate of change of an object's position with respect to time. It has both magnitude and direction, distinguishing it from speed, which is scalar. The velocity graph can be derived from the position graph by calculating the slope of the position curve at various points, indicating how quickly and in which direction the particle is moving.
Recommended video:
Graphical Interpretation
Graphical interpretation involves analyzing graphs to extract meaningful information about physical phenomena. In the context of position and velocity graphs, it requires understanding how to translate the shape and features of the position graph into a corresponding velocity graph. This includes recognizing intervals of constant velocity, acceleration, and deceleration, which are reflected in the slope of the position graph.
Recommended video:
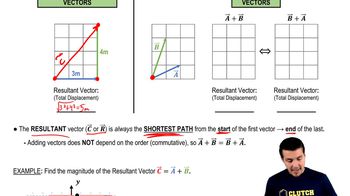
Adding Vectors Graphically


 03:04
03:04