Here are the essential concepts you must grasp in order to answer the question correctly.
Position vs. Time Graph
A position vs. time graph visually represents the location of an object over time. The x-axis typically represents time, while the y-axis represents position. The slope of the line indicates the object's velocity; a steeper slope means a higher speed. This graph is essential for comparing the motion of multiple objects, as it allows for a direct visual comparison of their positions at any given time.
Recommended video:
Curved Position-Time Graphs & Acceleration
Constant Velocity
Constant velocity refers to an object moving at a steady speed in a straight line without changing direction. In this scenario, both Ann and Carol are driving at constant velocities of 50 mph and 36 mph, respectively. This means their speeds do not vary over time, allowing for straightforward calculations of their positions at any given time using the formula: position = initial position + (velocity × time).
Recommended video:
Phase Constant of a Wave Function
Relative Positioning
Relative positioning involves understanding the locations of objects in relation to one another. In this problem, Carol starts at 2.4 miles and Ann at 0.0 miles, with different velocities. Analyzing their relative positions over time is crucial for determining when and where they might meet or how far apart they are at any given moment, which is key to accurately drawing the position vs. time graph.
Recommended video:
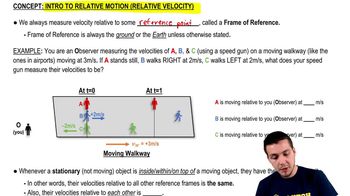
Intro to Relative Motion (Relative Velocity)
 Verified step by step guidance
 This video solution was recommended by our tutors as helpful for the problem above.
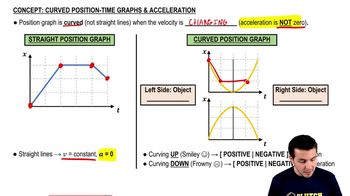
 03:04
03:04