In the following table, average differences of height, weight, and fingerprint ridge count between monozygotic twins (reared together and apart), dizygotic twins, and nontwin siblings are compared: Trait MZ Reared MZ DZ Reared Sibs Reared Together Reared Together Together Apart _Height (cm) 1.7 1.8 4.4 4.5 Weight (kg) 1.9 4.5 4.5 4.7 Ridge count 0.7 0.6 2.4 2.7 Based on the data in this table, which of these quantitative traits has the highest heritability values?
Corn plants from a test plot are measured, and the distribution of heights at 10-cm intervals is recorded in the following table:
Height (cm) Plants (no.)
100 20
110 60
120 90
130 130
140 180
150 120
160 70
170 50
180 40
Calculate
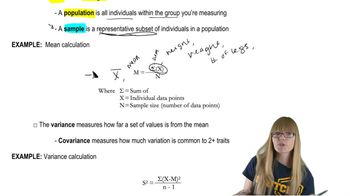
(a) the mean height,
(b) the variance,
(c) the standard deviation, and
(d) the standard error of the mean.
Plot a rough graph of plant height against frequency. Do the values represent a normal distribution? Based on your calculations, how would you assess the variation within this population?
 Verified step by step guidance
Verified Solution
Key Concepts
Mean

Variance and Standard Deviation

Normal Distribution

What kind of heritability estimates (broad sense or narrow sense) are obtained from human twin studies?
List as many human traits as you can that are likely to be under the control of a polygenic mode of inheritance.
The following variances were calculated for two traits in a herd of hogs.
Trait Vₚ VG VA _
Back fat 30.6 12.2 8.44
Body length 52.4 26.4 11.70
Which of the two traits will respond best to selection by a breeder? Why?
The following variances were calculated for two traits in a herd of hogs.
Trait Vₚ VG VA _
Back fat 30.6 12.2 8.44
Body length 52.4 26.4 11.70
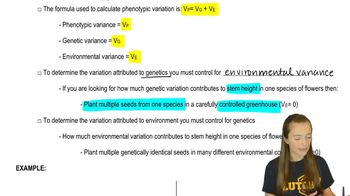
Calculate broad-sense (H²) and narrow-sense (h²) heritabilities for each trait in this herd.
The mean and variance of plant height of two highly inbred strains (P₁ and P₂) and their progeny (F₁ and F₂) are shown here.
Strain Mean (cm) Variance _
P₁ 34.2 4.2
P₂ 55.3 3.8
F₁ 44.2 5.6
F₂ 46.3 10.3
Calculate the broad-sense heritability (H²) of plant height in this species.
