Ch. 20 - Recombinant DNA Technology
Chapter 19, Problem 29

The gel presented here shows the pattern of bands of fragments produced with several restriction enzymes. The enzymes used are identified above the lanes of the gel, and six possible restriction maps are shown in the column to the right.

One of the six restriction maps shown is consistent with the pattern of bands shown in the gel.

From your analysis of the pattern of bands on the gel, select the correct restriction map and explain your reasoning. <>.

Verified step by step guidance
1
Analyze the gel electrophoresis pattern by identifying the number and size of bands in each lane.
Note the restriction enzymes used for each lane and the corresponding band patterns.
Compare the observed band patterns with the possible restriction maps provided.
For each restriction map, predict the expected band pattern when digested with the same enzymes.
Select the restriction map whose predicted band pattern matches the observed pattern on the gel.

Verified Solution

Video duration:
43s
This video solution was recommended by our tutors as helpful for the problem above.
Was this helpful?

Key Concepts

Here are the essential concepts you must grasp in order to answer the question correctly.

Restriction Enzymes

Restriction enzymes, or restriction endonucleases, are proteins that cut DNA at specific sequences, creating fragments of varying lengths. Each enzyme recognizes a unique sequence of nucleotides, allowing for precise manipulation of DNA. Understanding how these enzymes work is crucial for interpreting the banding patterns on a gel, as the size and number of fragments produced depend on the specific enzyme used.
Recommended video:
Guided course
07:11
Mapping with Markers

Gel Electrophoresis

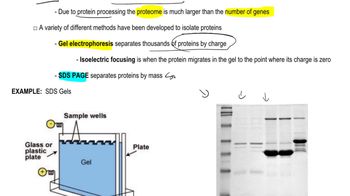
Gel electrophoresis is a laboratory technique used to separate DNA fragments based on their size. When an electric current is applied, smaller fragments move faster through the gel matrix than larger ones, resulting in distinct bands. Analyzing the distance each band travels allows researchers to infer the sizes of the DNA fragments, which is essential for matching the observed pattern to the correct restriction map.
Recommended video:

Restriction Maps

A restriction map is a diagram that shows the locations of restriction enzyme cut sites within a DNA sequence. It provides a visual representation of how a DNA molecule will be fragmented by specific enzymes. By comparing the banding pattern from gel electrophoresis to the possible restriction maps, one can determine which map corresponds to the observed fragments, aiding in the identification of the DNA sequence being analyzed.
Recommended video:
Guided course
07:11
Mapping with Markers
Related Practice
Textbook Question

Private companies are offering personal DNA sequencing along with interpretation. What services do they offer? Do you think that these services should be regulated, and if so, in what way? Investigate one such company, 23andMe, at http://www.23andMe.com, before answering these questions.

237
views
Textbook Question
Microsatellites are currently exploited as markers for paternity testing. A sample paternity test is shown in the following table in which ten microsatellite markers were used to test samples from a mother, her child, and an alleged father. The name of the microsatellite locus is given in the left-hand column, and the genotype of each individual is recorded as the number of repeats he or she carries at that locus. For example, at locus D9S302, the mother carries 30 repeats on one of her chromosomes and 31 on the other. In cases where an individual carries the same number of repeats on both chromosomes, only a single number is recorded. (Some of the numbers are followed by a decimal point, for example, 20.2, to indicate a partial repeat in addition to the complete repeats.) Assuming that these markers are inherited in a simple Mendelian fashion, can the alleged father be excluded as the source of the sperm that produced the child? Why or why not? Explain.
541
views
Textbook Question

As you will learn later in the text (Special Topics Chapter 1— CRISPR-Cas and Genome Editing), the CRISPR-Cas system has great potential but also raises many ethical issues about its potential applications because theoretically it can be used to edit any gene in the genome. What do you think are some of the concerns about the use of CRISPR-Cas on humans? Should CRISPR-Cas applications be limited for use on only certain human genes but not others? Explain your answers.

300
views
Textbook Question

The gel presented here shows the pattern of bands of fragments produced with several restriction enzymes. The enzymes used are identified above the lanes of the gel, and six possible restriction maps are shown in the column to the right.

One of the six restriction maps shown is consistent with the pattern of bands shown in the gel.

The highlighted bands (magenta) in the gel hybridized with a probe for the gene pep during a Southern blot. Where in the gel is the pep gene located? 

387
views
Textbook Question

A widely used method for calculating the annealing temperature for a primer used in PCR is 5 degrees below the melting temperature, Tₘ(°C), which is computed by the equation 81.5+0.41×(%GC)−(675/N), where %GC is the percentage of GC nucleotides in the oligonucleotide and N is the length of the oligonucleotide. Notice from the formula that both the GC content and the length of the oligonucleotide are variables. Assuming you have the following oligonucleotide as a primer,

5′-TTGAAAATATTTCCCATTGCC-3′

compute the annealing temperature for PCR. What is the relationship between  and %GC? Why? (Note: In reality, this computation provides only a starting point for empirical determination of the most useful annealing temperature.) <>

530
views
Textbook Question

Most of the techniques described in this chapter (blotting, cloning, PCR, etc.) are dependent on hybridization (annealing) between different populations of nucleic acids. Length of the strands, temperature, and percentage of GC nucleotides weigh considerably on hybridization. Two other components commonly used in hybridization protocols are monovalent ions and formamide. A formula that takes monovalent Na⁺ ions ((M[Na⁺]) and formamide concentrations into consideration to compute a Tₘ (temperature of melting) is as follows:

Tₘ=81.5+16.6(log M[Na+])+0.41(%GC)−0.72(%formamide)


For the following concentrations of Na⁺ and formamide, calculate the Tₘ. Assume 45% GC content.
    [Na⁺]     % Formamide
   0.825             20
   0.825             40
   0.165             20
   0.165             40

310
views