Ch.17 - Applications of Aqueous Equilibria
Chapter 17, Problem 41a

The following plot shows two pH titration curves, each representing the titration of 50.0 mL of 0.100 M acid with 0.100 M NaOH:
Graph showing pH titration curves for strong and weak acids with NaOH.
. (a) Which of the two curves represents the titration of a strong acid? Which represents a weak acid?

Verified step by step guidance
1
Identify the initial pH of each curve. The curve with the lower initial pH represents the strong acid, while the curve with the higher initial pH represents the weak acid.
Observe the shape of the titration curves. The strong acid will have a more pronounced and steeper vertical section at the equivalence point compared to the weak acid.
Determine the pH at the equivalence point. For a strong acid titration, the pH at the equivalence point will be around 7, while for a weak acid, it will be above 7.
Compare the buffering regions before the equivalence point. The weak acid will show a more significant buffering region, indicated by a more gradual slope before the steep rise.
Conclude which curve represents the strong acid and which represents the weak acid based on the initial pH, shape of the curve, pH at the equivalence point, and buffering regions.

Verified Solution

Video duration:
2m
This video solution was recommended by our tutors as helpful for the problem above.
Was this helpful?

Key Concepts

Here are the essential concepts you must grasp in order to answer the question correctly.

Titration Curves

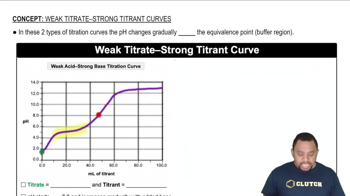
Titration curves graphically represent the change in pH of a solution as a titrant is added. The shape of the curve indicates the strength of the acid or base being titrated. A steep rise in pH indicates a strong acid or base, while a more gradual slope suggests a weak acid or base. The equivalence point, where the amount of titrant equals the amount of substance being titrated, is crucial for determining the strength of the acid or base.
Recommended video:
Guided course
02:16
Acid-Base Titration Curves

Strong vs. Weak Acids

Strong acids, such as hydrochloric acid (HCl), completely dissociate in water, resulting in a sharp increase in pH during titration. In contrast, weak acids, like acetic acid (CH₃COOH), only partially dissociate, leading to a more gradual pH change. This difference in dissociation behavior is reflected in the titration curves, where strong acids show a steep slope at the equivalence point, while weak acids exhibit a more gradual slope.
Recommended video:
Guided course
02:19
Weak Acid-Strong Base Titration Curve

pH and Neutralization

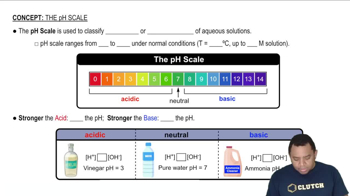
pH is a measure of the acidity or basicity of a solution, with lower values indicating acidic conditions and higher values indicating basic conditions. During a titration, the goal is to reach a neutralization point, where the acid and base completely react. The pH at this point can vary depending on whether a strong or weak acid is involved, influencing the shape of the titration curve and the final pH after the addition of the titrant.
Recommended video:
Related Practice
Textbook Question

The following pictures represent initial concentrations in solutions that contain a weak acid HA (pKa = 6.0) and its sodium salt NaA. (Na+ ions and solvent water molecules have been omitted for clarity.)

. (b) Draw a picture that represents the equilibrium state of solution (1) after the addition of two H3O+ ions.

499
views
Textbook Question

The following pictures represent solutions that contain one or more of the compounds H2A, NaHA, and Na2A, where H2A is a weak diprotic acid. (Na+ ions and solvent water molecules have been omitted for clarity.)

(a) Which of the solutions are buffer solutions?

392
views
Textbook Question

The following pictures represent solutions that contain one or more of the compounds H2A, NaHA, and Na2A, where H2A is a weak diprotic acid. (Na+ ions and solvent water molecules have been omitted for clarity.)

(b) Which solution has the greatest buffer capacity?

815
views
Textbook Question

The following plot shows two pH titration curves, each representing the titration of 50.0 mL of 0.100 M acid with 0.100 M NaOH:

. (b) What is the approximate pH at the equivalence point for each of the acids?

967
views
Textbook Question

The following plot shows two pH titration curves, each representing the titration of 50.0 mL of 0.100 M acid with 0.100 M NaOH:

. (c) What is the approximate pKa of the weak acid?

370
views
1
rank
Textbook Question

The following pictures represent solutions at various stages in the titration of a weak base B with aqueous HCl. (Cl- ions and solvent water molecules have been omitted for clarity.)

. (a) To which of the following stages do solutions 1–4 correspond? (i) The initial solution before addition of any HCl (ii) Halfway to the equivalence point (iii) At the equivalence point (iv) Beyond the equivalence point

809
views