Here are the essential concepts you must grasp in order to answer the question correctly.
Instantaneous Rate of Reaction
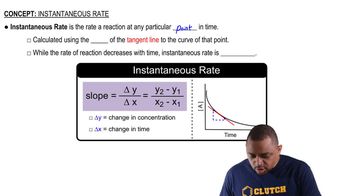
The instantaneous rate of a reaction refers to the rate at which reactants are converted to products at a specific moment in time. It can be determined from the slope of the tangent line to the concentration vs. time curve at that point. This concept is crucial for understanding how reaction rates change over time and allows for precise calculations at any given time.
Recommended video:
Concentration-Time Data
Concentration-time data represents how the concentration of a reactant or product changes over time during a chemical reaction. This data is typically plotted on a graph, with concentration on the y-axis and time on the x-axis. Analyzing this plot helps in determining both the average and instantaneous rates of reaction, as well as the overall kinetics of the process.
Recommended video:
Electrochemical Stoichiometric Chart (Time)
Kinetics of Decomposition Reactions
Kinetics studies the rates of chemical reactions and the factors affecting them. In the context of decomposition reactions, such as the breakdown of NO2, understanding the kinetics involves analyzing how concentration changes over time and the influence of temperature, pressure, and catalysts. This knowledge is essential for predicting reaction behavior and optimizing conditions for desired outcomes.
Recommended video:


