Here are the essential concepts you must grasp in order to answer the question correctly.
Instantaneous Rate vs. Average Rate
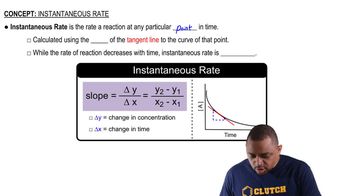
The instantaneous rate of a reaction refers to the rate at a specific moment in time, while the average rate is calculated over a defined time interval. To estimate the instantaneous rate at t = 350 s, one can analyze the average rates over various intervals that include this time point. Understanding the difference between these rates is crucial for accurately interpreting the data.
Recommended video:
Rate of Reaction
The rate of reaction quantifies how quickly reactants are converted into products. It can be expressed in terms of the change in concentration of a reactant or product over time. In this case, the focus is on the appearance of NO2, which requires calculating the change in its concentration over the specified time intervals to determine the rate.
Recommended video:
Data Interpretation from Graphs and Tables
Interpreting data from tables and graphs is essential for estimating rates of reaction. Table 14.1 likely provides concentration values at various times, while Figure 14.1 may illustrate the concentration changes graphically. Understanding how to extract and analyze this information allows for accurate calculations of average rates over the specified intervals.
Recommended video:
Periodic Table Classifications


 01:30
01:30
