Here are the essential concepts you must grasp in order to answer the question correctly.
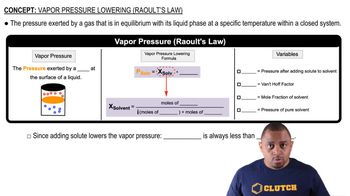
Vapor Pressure
Vapor pressure is the pressure exerted by a vapor in equilibrium with its liquid or solid phase at a given temperature. It indicates how readily a substance evaporates; higher vapor pressure means a substance evaporates more easily. In the context of the phase diagram, the vapor pressure curves show how the pressure changes with temperature for both the pure liquid and the solution.
Recommended video:
Raoult's Law and Vapor Pressure
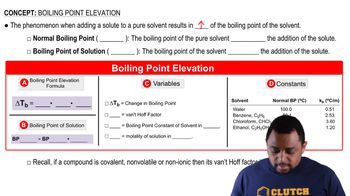
Boiling Point
The boiling point of a liquid is the temperature at which its vapor pressure equals the external pressure surrounding the liquid. At this point, the liquid transitions to a gas. In the phase diagram, the boiling point can be determined by finding where the vapor pressure curve intersects the 1 atm line, which is crucial for comparing the boiling points of the first and second liquids.
Recommended video:
Raoult's Law
Raoult's Law states that the vapor pressure of a solvent in a solution is directly proportional to the mole fraction of the solvent present. When a volatile solute is added to a solvent, the overall vapor pressure of the solution decreases compared to the pure solvent. This principle helps explain why the boiling point of the solution (red curve) is higher than that of the pure solvent (green curve), indicating that the second liquid has a higher boiling point.
Recommended video:
Raoult's Law and Vapor Pressure


 02:40
02:40