Here are the essential concepts you must grasp in order to answer the question correctly.
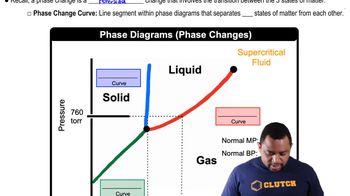
Phase Diagrams
A phase diagram is a graphical representation that shows the phases of a substance as a function of temperature and pressure. It illustrates the boundaries between different phases, such as solid, liquid, and gas, and indicates conditions under which these phases coexist. In this case, the phase diagram for ether and a solution helps visualize how the vapor pressure changes with temperature for both pure ether and a solution containing a nonvolatile solute.
Recommended video:
Phase Changes in Diagrams
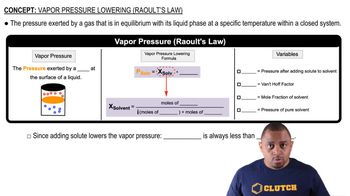
Raoult's Law
Raoult's Law states that the vapor pressure of a solvent in a solution is directly proportional to the mole fraction of the solvent present. This principle is crucial for understanding how the addition of a nonvolatile solute affects the vapor pressure of the solvent, leading to a decrease in vapor pressure compared to that of the pure solvent. This law is fundamental in calculating the molal concentration of the solute based on the observed changes in vapor pressure.
Recommended video:
Raoult's Law and Vapor Pressure
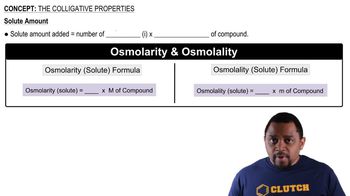
Colligative Properties
Colligative properties are properties of solutions that depend on the number of solute particles in a given amount of solvent, rather than the identity of the solute. These properties include vapor pressure lowering, boiling point elevation, freezing point depression, and osmotic pressure. In this question, the focus is on vapor pressure lowering, which is essential for determining the molal concentration of the solute in the ether solution.
Recommended video:


 03:22
03:22