Ch.11 - Liquids and Intermolecular Forces

Chapter 11, Problem 87

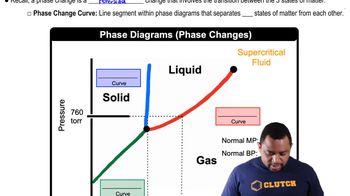
Naphthalene (C10H8) is the main ingredient in traditional mothballs. Its normal melting point is 81 °C, its normal boiling point is 218 °C, and its triple point is 80 °C at 1000 Pa. Using the data, construct a phase diagram for naphthalene, labeling all the regions of your diagram.

Verified Solution
Video duration:
2m
This video solution was recommended by our tutors as helpful for the problem above.
2401
views
Was this helpful?

Video transcript

Hello everyone today. We are being told to draw the phase diagram for iodine given the following data. So the first thing we're gonna do is we're gonna construct our graph as such. We're gonna have our Y access, we're gonna have our X axis per usual. Our pressure in killer pascal's is gonna go on our Y axis and our temperature and Celsius is gonna go on our X axis. And so we're gonna draw the typical phase diagram as such. Per usual. We have our solid region, we have our liquid region and we have our gas region. So we're gonna go through each of these points and we're going to label them on this graph. So we have our normal melting point which is 113.7°C. And our melting point is going to be a point between a solid and or liquid. And so we can put that right about here are 117° Associates right about there. And so we know that that happens at our our normal melting point. It's going to happen at one atmosphere And one atmosphere is going to be equal to 101.3 killer pass scales. And so if we connect this all the way over to the left here, we have 103 killer Pascal's on the left there. So that takes care of our first one. Our normal boiling point is 184.3. You know boiling point is going to be a region between our liquid and the gas. So that's gonna go right here. So we have 184. and that is also going to occur at that one oh 1. killer pascal's or one atmosphere. Our triple point is going to be a point where each of these phases meat, that's gonna be at this point here, That's gonna be 1 13.5, which is right next to that normal melting point. And that occurs at 12.1 Killer Pascal's. So we'll draw that dotted line there for our last and final point. We have our super critical point, which is at 546°C and that's going to be our highest point between our liquid and a gas up here. And so I stated before, that occurs at 546°C at 11,700 killer Pascal's and so with that we have constructed our face diagram as such. Overall, I hope this helped. And until next time.
Related Practice
Textbook Question

The following table gives the vapor pressure of hexafluorobenzene (C6F6) as a function of temperature: (a) By plotting these data in a suitable fashion, determine whether the Clausius–Clapeyron equation (Equation 11.1) is obeyed. If it is obeyed, use your plot to determine ∆Hvap for C6F6.

575
views
Textbook Question

Suppose the vapor pressure of a substance is measured at two different temperatures. (a) By using the Clausius–Clapeyron equation (Equation 11.1) derive the following relationship between the vapor pressures, P1 and P2, and the absolute temperatures at which they were measured, T1 and T2: (b) Gasoline is a mixture of hydrocarbons, a component of which is octane (CH3CH2CH2CH2CH2CH2CH2CH3). Octane has a vapor pressure of 13.95 torr at 25 °C and a vapor pressure of 144.78 torr at 75 °C. Use these data and the equation in part (a) to calculate the heat of vaporization of octane. (c) By using the equation in part (a) and the data given in part (b), calculate the normal boiling point of octane. Compare your answer to the one you obtained from Exercise 11.81. (d) Calculate the vapor pressure of octane at - 30 °C.

718
views
Textbook Question
The following data present the temperatures at which certain vapor pressures are achieved for dichloromethane (CH2Cl2) and methyl iodide (CH3I): (c) The order of volatility of these two substances changes as the temperature is increased. What quantity must be different for the two substances for this phenom- enon to occur?
377
views
Textbook Question

A particular liquid crystalline substance has the phase diagram shown in the figure. By analogy with the phase diagram for a nonliquid crystalline substance, identify the phase present in each area.

563
views
Textbook Question

In Table 11.3, we saw that the viscosity of a series of hydrocarbons increased with molecular weight, doubling from the six-carbon molecule to the ten-carbon molecule.

(a) The eight-carbon hydrocarbon, octane, has an isomer, isooctane. Would you predict that isooctane would have a larger or smaller viscosity than octane? Why?

529
views
Textbook Question

The vapor pressure of ethanol (C2H5OH) at 19 °C is 40.0 torr. A 1.00-g sample of ethanol is placed in a 2.00 L container at 19 °C. If the container is closed and the ethanol is allowed to reach equilibrium with its vapor, how many grams of liquid ethanol remain?

1362
views