Textbook Question
Write an equation for each line described. Give answers in standard form for Exercises 11–20 and in slope-intercept form (if possible) for Exercises 21–32. through (5,-8), m = 0
518
views

 Verified step by step guidance
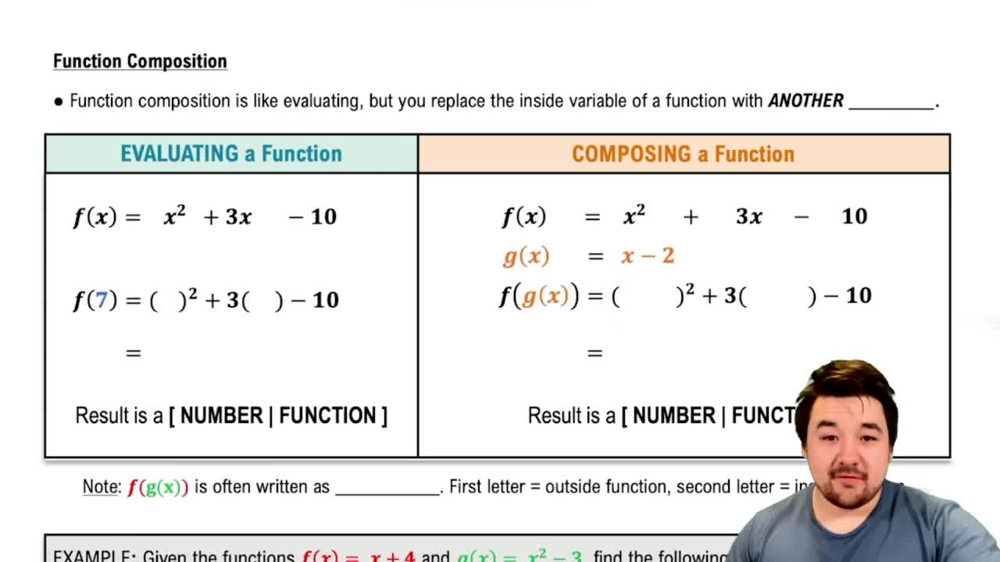
 4:56
4:56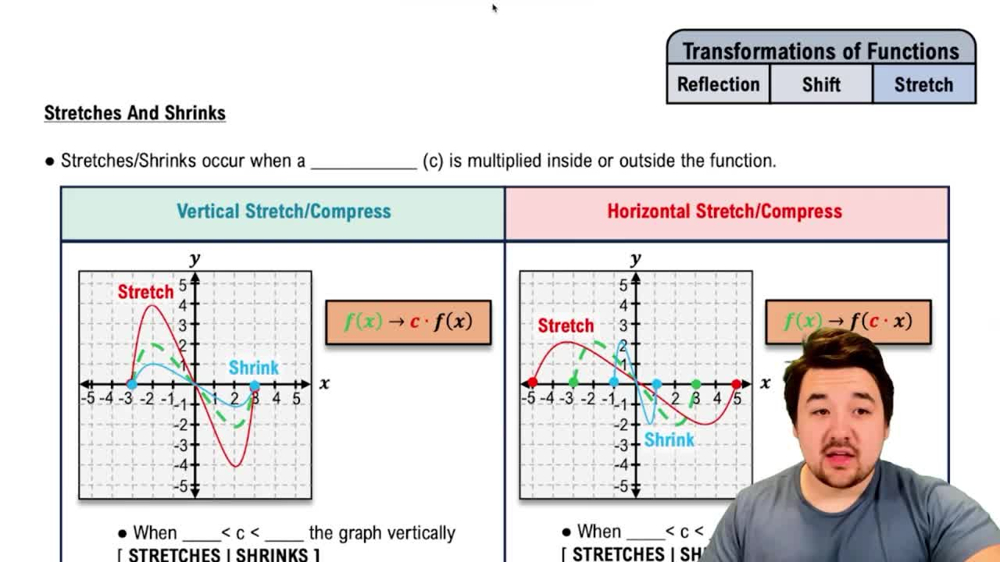 6:02
6:02 5:26
5:26Write an equation for each line described. Give answers in standard form for Exercises 11–20 and in slope-intercept form (if possible) for Exercises 21–32. through (5,-8), m = 0
In the following exercises, (a) find the center-radius form of the equation of each circle described, and (b) graph it. center (-2, 5), radius 4
Determine whether each relation defines a function.
Let ƒ(x)=x^2+3 and g(x)=-2x+6. Find each of the following. See Example 1.
(ƒ/g)(5)
Determine whether each relation defines a function.
Graph each function. See Examples 1 and 2. ƒ(x)=2/3|x|