Everyone, welcome back. So previously in other videos, we've seen how to graph a one-dimensional inequality, something like \(x \geq 1\). It was pretty straightforward. You just find the point \(x = 1\) on a number line, and then you would just sort of figure out all of the numbers that satisfy this inequality. And it would be everything to the right of that point. But we're going to do the exact same thing here for a 2-dimensional inequality. It's just that now our equations that we've been dealing with have multiple variables like \(y\) and \(x\). So the whole idea is that we're going to have to plot inequalities now on a 2-dimensional graph instead of just a 1-dimensional number line. But I'm going to show you that it's pretty straightforward, and I'm going to show you a step-by-step way to do this. So let's go ahead and take a look here. So if I had to graph the inequality \(y\), or sorry, \(x \geq 1\) on a 2-dimensional number line, let's see how this would work here. Now we've already seen what the equation \(x = 1\) looks like. Remember, on a two-dimensional graph, this will actually be a vertical line. It's kind of weird because on a one-dimensional number line, it's just a point. But remember, now we have the sort of a we have a \(y\)-axis, so you almost could kind of, like, extend this up and down. You'll see that you'll get a vertical line. So the key whole idea here is that to graph an inequality, first, you actually have to graph what the corresponding line is. But now we have to look at sort of how to shade the parts of the graph that will satisfy this inequality. And so what you're gonna do here is you're gonna shade the side of the graph with points that make the inequality true. You remember, you're just going to figure out the points that make this inequality a true statement. And what I can do here is just sort of, like, pick random points. Like, let's say, for example, I pick this point, \(2, 0\). If I take these \(x\) and \(y\) coordinates and I plug them into this inequality, we'll see that we get true statements for this. For example, the \(x\) coordinate for this is 2, so \(2 \geq 1\). That is a true statement. But now we also have, like, an infinite number of \(y\) values to consider. We can pick, like, a point over here. This would be \(4, 3\). When you plug it into this inequality, you'll also get a true statement. So the key difference here is that we're not just gonna shade the axis like one line. We're actually going to have to shade everywhere in this graph with points that satisfy this inequality. And for this particular line, it's actually going to be all of these points that are to the right of this inequality. So it kinda makes sense. For a one-dimensional number line, you just had a line. For a two-dimensional graph, we actually have, like, an area, a region of points that satisfy this inequality. Alright? So that's all there is to it. All the points on this side of the graph are where \(x > 1\), so that satisfies this inequality. All the points over here are less than 1. So if you had something like \(y < x\), for example, we could graph this pretty simply. All you'd have to do is just graph the corresponding line, \(y = x\). Now one thing I want to point out here is the symbols are different. Notice we have a less than symbol, whereas we had a greater than or equal to symbol. So if you have equations with the less than or equal to or greater than or equal to symbols, you draw a solid line. The way I like to think about this is if you see a solid bar underneath the symbol, then you draw a solid line. But if you have something like less than or greater than or less than, then you draw a dashed line. So \(y < x\) is going to look like \(y = x\), but we're going to have to draw it with a dashed line. So it's basically going to look something like this. Alright. Now, these examples are pretty straightforward, but sometimes you're going to get more complicated equations, something like \(y > 2x - 4\). So I actually want to show you a step-by-step process of how to graph those inequalities. Let's get started here. So the first thing you want to do is you're gonna graph the solid or dashed line depending on the symbol by switching the inequality symbol with an equal sign. So remember that this graph this symbol over here means that we're gonna be drawing a dashed line. And the way we graph this is by graphing the corresponding line. What does \(y = 2x - 4\) look like? Well, it just looks like a line that goes through the y-intercept of negative 4 and has a slope of 2. So it's going to look something like this. Remember, we have to use a dashed line for this. So this is going to be what that graph looks like. It's kind of just, like, sketched out. So that's the first step. Right? So the second thing we have to do is we have to figure out which points will satisfy our inequality. With \(x \geq 1\), it was pretty simple because we just highlighted everything to the right of this graph. But for this, it's gonna be a little bit tricky. Right? So is it gonna be this side over here? Is it gonna be this side? How does it actually work out for different angles and different steepnesses? So the second step is you're actually going to basically test a point on either side of the line. And the way that you test it is you just basically plug or by plugging the \(x\), \(y\) coordinates into the inequality, which is exactly like what we did with this \(2, 0\) over here. So the idea is that we'
Graphing Systems of Inequalities - Online Tutor, Practice Problems & Exam Prep
 Created using AI
Graphing inequalities involves plotting corresponding lines or curves and determining which regions satisfy the inequality. For linear inequalities, use solid lines for "greater than or equal to" and "less than or equal to," while dashed lines are for strict inequalities. Testing points helps identify the correct shaded area. Nonlinear inequalities, like quadratics, follow the same process, focusing on the region above or below the curve. When dealing with multiple inequalities, the solution is found in the overlapping shaded regions, which represent points satisfying all inequalities simultaneously.
Linear Inequalities
Video transcript
Example 1
Video transcript
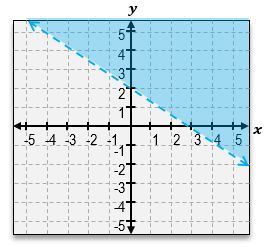
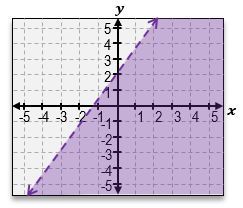
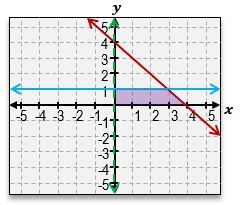
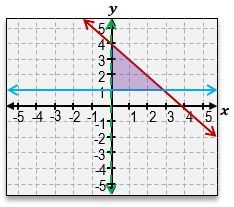
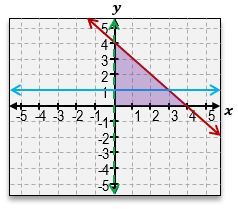
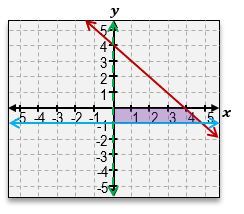
Welcome back, everyone. Let's continue our journey through systems of inequalities by taking a look at this example problem here. Here, we're told we're given these three equations, a, b, and c, and we're told to match each inequality with its graph. So we're not actually going to graph anything; we're just going to be matching up equations to graphs. Let's go ahead and get started here. So, I've got equation a, which is y>-3x+4. Then for equation b, we've got x+y<1. Equation c is -3x-y>=-4. Let's take a look at the first equation over here. y>-3x+4. Now, in order to visualize the graph, remember, the first thing you do is just pretend here that there is an imaginary equal sign. What does the graph of -3x+4 look like? It looks like an equation of a line with a y-intercept of 4. If you look through these two graphs, there are 2 equations with y-intercepts of 4. The graphs 2 & 3. And they almost look the same, except how the shading is in different areas, and one solid, and one is a dashed line. So which one does this equation correspond to? The next thing you should look at is the symbol that we see; because here we see a greater than symbol. Whenever you see a greater than symbol or a less than symbol without the solid bar underneath, that means we're dealing with a dashed line, not a solid line. So that means that without a doubt, equation a corresponds to graph number 3. So this corresponds to graph a. Alright?
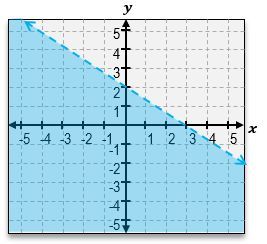
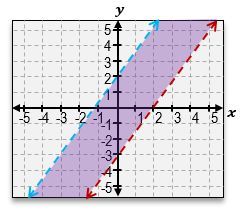
And if you can see here, we've got the dashed line with a negative slope of 3, and we also can see that the shaded area is everything that's above that line, which is exactly what the shortcut for lines tells us. Notice how this symbol here is a greater sign, so we're going to shade everything that's above that line. Alright. So now let's take a look at equation b. x+y<1. So this may be hard to visualize what the graph looks like, so let's rewrite it in slope intercept form. I could just move the x to the other side by subtracting x, and this is going to be y<-x+1. So, same thing over here. We've got a y-intercept of positive one. And notice how what I said in the beginning or when we were dealing with the first equation is that these two lines have y-intercepts of 4. The only one that has a y-intercept of 1 is going to be this line. So this is definitely corresponds to equation b. Alright? And just to sort of double-check here, we can see that this equation tells us that we should be dealing with a dashed line because it's just a less than symbol, and that's exactly what we have. We have a dashed line. It's got a slope of negative one. And, also, what we can see is that because of the less than symbol, our shortcut tells us that we have to shade everything that's below that graph. So this is, without a doubt, the equation for the graph of b. And that just means that by default, this second graph over here is going to be the equation for c. But let's understand why that works.
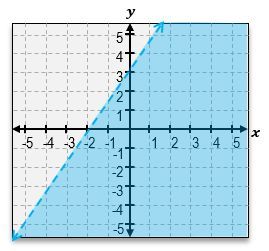
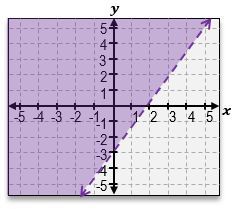
So here, we've got this other sort of more complicated, nasty expression. One of the things that you can do here is you can sort of tell that all of these graphs or these numbers here have a negative sign. And so one thing you can do is you can actually flip all of those to positives, but then you have to flip the inequality symbol. So one way this sort of, like, simplifies is this actually just turns into 3x+y<=4. When you flip all the signs, you actually flip the symbol as well. And finally, what we can do is move the 3x to the other side, which you'll get is y<=-3x+4. That would be in slope-intercept form. So, again, notice how we still have that positive 4, of a y-intercept. We still have the same slope of negative 3. But now what happens is that we have a less than or equal to, so this should be a solid line, and we should shade everything that's underneath that line instead of above like we did for graph number 3. Alright? So that means that this is definitely the equation or the equation for this graph over here.
Alright. So that's it, folks. Let me know if you have any questions, and thanks for watching. I'll see you in the next video.
Graph the inequality < .
Nonlinear Inequalities
Video transcript
Everyone, welcome back. So in previous videos, we saw how to graph linear inequalities, something like y>2x-1. But now you might start to see problems in which you have nonlinear equations, things like quadratics or exponentials, radicals, and rational functions, things like that. You might think that it's an entirely new process, but I'm actually going to show you here that graphing nonlinear inequalities is exactly like graphing linear inequalities. We're actually going to follow the exact same list of steps here. So let's just jump right into this problem and see how it works. We've got y≥x2-1. This is clearly going to be a quadratic equation. Right? So we have something squared. So let's just go ahead and stick to the steps here. The first thing we do is figure out if we're dealing with a solid or dashed line. Let's look at the symbol. So we see a greater than or equal to symbol. If I see a solid line underneath, it's going to be a solid line. That's going to be my equation. Alright? So what does x2-1 look like? Well, first, you're going to have to sort of pretend that there's, like, an equal sign there. So y=x2-1 is going to be a parabola in which the vertex is going to be at 0,-1, and then it opens up like this. So what's going to happen is you're going to look something like this. I'm just going to sketch it out. It doesn't actually have to be perfect unless your professor really wants this to be perfect. But this is going to be what our parabola looks like. Right? So that's y=x2-1. Let's take a look at the second step. The second step says we're going to test the points on either side by plugging and, actually, it doesn't need to be a line. It could be a curve or something like that. By plugging x,y, the values, into the inequality. Alright? So we can use something on the x or y axis. So we could just pick a point at random. What I'm going to do is I'm just going to pick this point over here, 0,2. That's pretty much, like, well within, sort of the upper portion of the parabola. So let's go ahead and test this out, 0,2. Remember, this is just my x and y values. So what this means here is that y≥x2-1. So I'm just going to replace them now. 2≥02-1. So does this make a true statement? Well, what you'll see here is that you get 2≥02is just0,and is 2 greater than or equal to negative one?0. This actually is a true statement. 2≥-1. So because this is a true statement now, we can move on to step number 3. We're just going to shade the side that includes that point. If our statement is true, we include that point. So really all this is here is, remember, the curve or this equation here is kind of like a barrier. We can't shade anything that's on the opposite side of that barrier. So you might think, oh, well, I just shade everything that's above this line over here, but that's not how it works. Because if you were to pick a point, let's say, that's out here on above the equation or above the graph but still on the opposite side of this line, you'll find that this actually won't be true. So what you have to do is you're sort of, like, bounded by the shape of the graph itself. So really, the points that make this this inequality true are actually going to be everything that's just above the parabola, but still kind of, like, on the inside of it. So it's kind of, like, on the inside of the bowl. Alright? And that's really all there is to it. So that would be how to graph this inequality and shade the appropriate areas. Alright. So that's how to graph nonlinear inequalities. Let's go ahead and take a look at some practice.
Graph the inequality < .
Example 2
Video transcript
Welcome back, everyone. So just in case you were struggling with this problem, I'm here to help. So we're going to graph this inequality, x2+y-12≤9. So let's get started here with our steps. First, we're going to have to figure out whether you're dealing with a solid or a dashed line, and we do this by looking at the equation or the inequality symbol. So remember, if there's a bar underneath the symbol, that means it's going to be a solid line. That's exactly what we have here. So we're going to have a solid line, not dashed, and we're going to have to graph this by switching the inequality symbol with an equal sign. So we're basically just going to have to graph the inequality x2+y-12=9. All right?
So what does this look like? You may have been trying to rearrange this and trying to solve for a while, and you'll get some weird square roots. But, actually, if you remember here that we've dealt with these kinds of formulas before, this basically is kind of like the equation x-h2+y-k2= r2. If you remember this, this is the equation for circles. So circles over here have, like, an x2 and y2 equal to something on the right side, and these numbers h and k just represent the vertex. So what this looks like, this equation here, is it's a circle, and the center is going to be at the coordinates that are inside of the parentheses. So here, if we have no numbers inside of the parentheses, that means it's 0. So center is at the coordinate 0 comma, and then this number over here gives us our k value. And remember, when we see a minus sign, that means the k is actually positive. So this is a circle with a center at 0 comma 1. All right? So that's what this formula is—the circle is going to look like. So the circle center is going to be here at 0 comma 1. But remember, we actually need the radius of the circle, and that's given to us by this information over here, the number that's on the right side. So clearly, we can see that this r2 is equal to 9. And so the radius r is equal to the square root of 9, which is just equal to 3. So remember, what we're going to have to do is we're going to have to go up, down, and to the right and left by 3 units. We're going to have to connect all of those points over here. Alright? So this is going to be, 1, 2, 3, and we're going to have to graph a circle that connects all of these points together. All right? And once I do this, it's going to look something like this. All right. So that's sort of like my crude circle there. So remember, we're going to use a solid line for this, but this is basically what our graph is going to look like.
Now let's take a look at the second step over here, which is we're going to have to test a point. Because even if you got this far, you may not have noticed where to shade this graph. Do we always go below the circle? Do we go above it? What's going on here? So let's go ahead and test the points, that's on the x or y axis. All right? So what I'm going to do is I'm going to test the points. I'm just going to test this point over here, which is the point 2, 0. All right? So let's test this out. So what about 2, 0? So what this is saying here is that you're going to have to do 2 squared plus, and then you're going to have to do 0 minus 1 squared is less than or equal to the number 9. All right. So let's actually just move this over here and test this out. So this is going to be 4 plus then we've got 0 minus 1, which is negative 1, squared, which is positive 1. 4 plus 1 is less than or equal to 9. So in other words, is 5 less than or equal to 9? That is actually a true statement. So 5 is less than or equal to 9. So that means we're going to have to shade the point that includes that point, within the graph. So but does that mean that we actually have to graph everything that's below the circle? Well, actually, no. And the way you can sort of test this out is you can sort of test out now this point over here that is still below the circle but outside of it. And what you actually see here is that if you test this point over here, you'll see that the inequality actually fails. And so what happens here is we actually have to shade the area that's actually within the circle. So these types of inequalities are a little bit trickier because you can't just shade everything that's below the circle or the center of the circle. You actually have to test all these points, which you'll see is that only the points within the circle will actually make the inequality true. All right? So that's how to graph these types of inequalities with equations of circles. Let me know if you have any questions, and thanks for watching.
Systems of Inequalities
Video transcript
Everyone, welcome back. Up until now, we've learned how to graph individual inequalities, like this one. The basic idea was to draw the inequality, test points, and then shade the area that makes the inequality true with those points. But now we're going to look at problems that have multiple inequalities. In this case, we will repeat this process over and over, following the same steps for as many inequalities as we have. We'll see something interesting happen.
For example, if we graph an inequality, it might look like this. The shading area of this inequality will overlap with the shading area of the first graph. In this area, all the shadings will overlap, and this will be the solution to the system of inequalities. The whole idea is to graph a system of inequalities by plotting all the lines, all the curves, and shading the regions containing points that make all of the inequalities true. We'll use different colors and styles of shading, shading each curve first, and later finding the overlap. Let's follow these steps with our first example:
We've got \( y \leq -x + 4 \). First, we graph a solid line because we have a solid symbol underneath the equation. We replace it with an equal sign, and graph \( y = -x + 4 \). This line goes through the point \( (0, 4) \) with a slope of -1. To test the points, we choose any point along this area. We select the point \( (0, 2) \). Testing this point, we realize \( 2 \leq 4 \), which is a true statement. So, this area satisfies the inequality, represented as a red equation here.
We then perform the same steps for the blue equation, graphing \( y > 2x + 1 \). With a \( y \)-intercept of 1 and a slope of 2, this will be a dashed line due to the symbol. We can test the point \( (0, 2) \) again, checking if \( 2 > 1 \), which it does. Therefore, this inequality is true for this region, and we shade it accordingly.
After shading both equations, we'll find regions that overlap, showing the truly shared solution areas. We could also use different styles of hatching to distinguish between these regions until they overlap. This step will show the points that satisfy all conditions simultaneously, representing the complete solution to the system of inequalities.
One additional point: one or more equations may be non-linear. For instance, if we graph \( y \geq x^2 - 4 \), it forms a parabola with the vertex \( (0, -4) \) and shades everything above this parabola, being a solid line due to the inequality. Similarly, \( y > -x + 3 \) graphs a line through \( (0, 3) \) with a slope of -1, requiring the shading under this line. The overlap between these areas will show where both conditions fulfill.
Some systems of inequalities might have no solutions, which we'll examine later. Let me know if you have any questions regarding this process!
Graph the system of inequalities and indicate the region (if any) of solutions satisfying all equations.
<
Graph the system of inequalities and indicate the region (if any) of solutions satisfying all equations.
Do you want more practice?
More setsHere’s what students ask on this topic:
How do you graph a system of linear inequalities?
To graph a system of linear inequalities, follow these steps:
- Graph each inequality separately by first plotting the corresponding line. Use a solid line for ≤ or ≥ and a dashed line for < or >.
- Determine which side of the line to shade by testing a point not on the line (usually the origin is a good choice). If the point satisfies the inequality, shade that side.
- Repeat the process for all inequalities in the system.
- The solution to the system is the region where the shaded areas overlap, representing points that satisfy all inequalities simultaneously.
Created using AIWhat is the difference between graphing linear and nonlinear inequalities?
Graphing linear inequalities involves plotting straight lines and shading regions based on the inequality sign. For nonlinear inequalities, such as quadratics, the process is similar but involves curves like parabolas. The key steps are:
- Replace the inequality sign with an equal sign to plot the corresponding line or curve.
- Use a solid line for ≤ or ≥ and a dashed line for < or >.
- Test a point to determine which side of the line or curve to shade.
- For nonlinear inequalities, focus on regions above or below the curve.
Created using AIHow do you determine which region to shade when graphing an inequality?
To determine which region to shade when graphing an inequality, follow these steps:
- Graph the corresponding line or curve by replacing the inequality sign with an equal sign.
- Choose a test point not on the line or curve (the origin is often a good choice).
- Substitute the test point's coordinates into the inequality.
- If the inequality is true, shade the region containing the test point. If false, shade the opposite region.
This method ensures you shade the correct area that satisfies the inequality.
Created using AIWhat are the steps to graph a quadratic inequality?
To graph a quadratic inequality, follow these steps:
- Replace the inequality sign with an equal sign to plot the corresponding parabola.
- Determine if the parabola should be solid (for ≤ or ≥) or dashed (for < or >).
- Identify the vertex and plot the parabola.
- Choose a test point not on the parabola and substitute its coordinates into the inequality.
- If the inequality is true, shade the region inside the parabola (for > or ≥) or outside (for < or ≤).
This process helps you accurately graph and shade the correct region for quadratic inequalities.
Created using AIHow do you find the solution to a system of inequalities?
To find the solution to a system of inequalities, follow these steps:
- Graph each inequality separately, using solid or dashed lines as appropriate.
- Shade the region that satisfies each inequality by testing points.
- The solution to the system is the region where all shaded areas overlap.
- This overlapping region represents the set of points that satisfy all inequalities in the system simultaneously.
Using different colors or shading styles can help visualize the overlapping regions more clearly.
Created using AIYour College Algebra tutors


- Graph the solution set of each system of inequalities.x≤4x\le4x≤4x≥0x\ge0x≥0y≥0y\ge0y≥0x+2y≥2x+2y\ge2x+...
- Graph the solution set of each system of inequalities.2y+x≥−52y+x\ge-52y+x≥−5y≤3+xy\le3+xy≤3+xx≤0x\le0x≤0...
- Graph the solution set of each system of inequalities.2x+3y≤122x+3y\le122x+3y≤122x+3y>−62x+3y>-62x+3y...
- Graph the solution set of each system of inequalities.y>x2+2y>x^2+2y>x2+2y≤x−2y\le x-2y≤x−2
- Graph the solution set of each system of inequalities.3x−2y≥63x-2y\ge63x−2y≥6x+y≤−5x+y\le-5x+y≤−5y≤4y\le4...
- Graph the solution set of each system of inequalities.y≤x3−xy\le x^3-xy≤x3−xy>−3y>-3y>−3
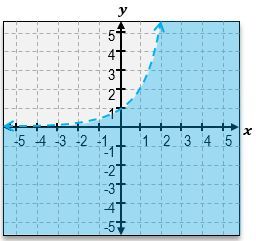
- Graph the solution set of each system of inequalities.y≥3xy\ge3^{x}y≥3xy≥2y\ge2y≥2
- Graph the solution set of each system of inequalities.y≤logxy\le\log xy≤logxy≥∣x−2∣y\ge\left|x-2\right|y≥∣...
- Graph the solution set of each system of inequalities.ex−y≤1e^{x}-y\le1ex−y≤1x−2y≥4x-2y\ge4x−2y≥4
- In Exercises 46–55, graph the solution set of each system of inequalities or indicate that the system has no s...
- In Exercises 46–55, graph the solution set of each system of inequalities or indicate that the system has no s...
- In Exercises 39–45, graph each inequality. y ≤ 2^x
- In Exercises 39–45, graph each inequality. y ≤ x^2 - 1
- In Exercises 39–45, graph each inequality. y ≤ (-1/2)x + 2
- In Exercises 39–45, graph each inequality. 3x - 4y > 12
- Graph each inequality. x + 2y ≤ 6
- Graph each inequality. 4y - 3x ≤ 5
- Graph each inequality. x < 3 + 2y
- Graph each inequality. 2x > 3 - 4y
- Graph each inequality. x ≤ 3
- Graph each inequality. y < 3x^2 + 2
- Graph each inequality. y > (x - 1)^2 + 2
- Graph each inequality. x^2 + (y + 3)^2 ≤ 16
- Graph each inequality. y > 2^x + 1
- Graph each inequality. y ≤ log(x - 1) - 2
- Work each problem. Write the inequality that represents the region inside a circle with center (-5, -2) and r...
- Match each inequality with the appropriate calculator graph in A–D. Do not use a calculator y ≤ -3x - 6
- Graph the solution set of each system of inequalities. x + y ≥ 0 2x - y ≥ 3
- Graph the solution set of each system of inequalities. 2x + y > 2 x - 3y < 6
- Graph the solution set of each system of inequalities. 3x + 5y ≤ 15 x^2 + y^2 < 9
- Graph the solution set of each system of inequalities. 4x - 3y ≤ 12 y ≤ x^2
- Graph the solution set of each system of inequalities. x + 2y ≤ 4 y ≥ x^2 - 1
- Graph the solution set of each system of inequalities. y ≥ (x - 2)^2 + 3 y ≤ -(x - 1)^2 + 6
- Graph the solution set of each system of inequalities. y ≥ x^2 + 4x + 4 y < -x^2
- In Exercises 1–26, graph each inequality. x+2y≤8
- In Exercises 1–26, graph each inequality. x−2y>10
- In Exercises 1–26, graph each inequality. y≤(1/3)x
- In Exercises 1–26, graph each inequality. y>2x−1
- In Exercises 1–26, graph each inequality. x≤−3
- In Exercises 1–26, graph each inequality. y>−3
- In Exercises 1–26, graph each inequality. x^2+y^2≤1
- In Exercises 1–26, graph each inequality. x^2+y^2>25
- In Exercises 1–26, graph each inequality. (x−2)^2+(y+1)^2<9
- In Exercises 1–26, graph each inequality. y
- In Exercises 1–26, graph each inequality. y≥x^2−9
- In Exercises 1–26, graph each inequality. y≥log_2(x+1)
- In Exercises 27–62, graph the solution set of each system of inequalities or indicate that the system has no s...
- In Exercises 27–62, graph the solution set of each system of inequalities or indicate that the system has no s...
- In Exercises 27–62, graph the solution set of each system of inequalities or indicate that the system has no s...
- In Exercises 27–62, graph the solution set of each system of inequalities or indicate that the system has no s...
- In Exercises 27–62, graph the solution set of each system of inequalities or indicate that the system has no s...
- In Exercises 27–62, graph the solution set of each system of inequalities or indicate that the system has no s...
- In Exercises 27–62, graph the solution set of each system of inequalities or indicate that the system has no s...
- In Exercises 27–62, graph the solution set of each system of inequalities or indicate that the system has no s...
- In Exercises 27–62, graph the solution set of each system of inequalities or indicate that the system has no s...
- In Exercises 27–62, graph the solution set of each system of inequalities or indicate that the system has no s...
- In Exercises 27–62, graph the solution set of each system of inequalities or indicate that the system has no s...
- In Exercises 27–62, graph the solution set of each system of inequalities or indicate that the system has no s...
- In Exercises 27–62, graph the solution set of each system of inequalities or indicate that the system has no s...
- In Exercises 27–62, graph the solution set of each system of inequalities or indicate that the system has no s...
- In Exercises 27–62, graph the solution set of each system of inequalities or indicate that the system has no s...
- In Exercises 27–62, graph the solution set of each system of inequalities or indicate that the system has no s...
- In Exercises 27–62, graph the solution set of each system of inequalities or indicate that the system has no s...
- In Exercises 63–64, write each sentence as an inequality in two variables. Then graph the inequality. The y-va...
- In Exercises 65–68, write the given sentences as a system of inequalities in two variables. Then graph the sys...
- In Exercises 65–68, write the given sentences as a system of inequalities in two variables. Then graph the sys...
- In Exercises 69–70, rewrite each inequality in the system without absolute value bars. Then graph the rewritte...
- In Exercises 57–59, graph the region determined by the constraints. Then find the maximum value of the given o...
- In Exercises 57–59, graph the region determined by the constraints. Then find the maximum value of the given o...
- Find the value of the objective function z = 2x + 3y at each corner of the graphed region shown. What is the m...
- Find the maximum and minimum values of each objective function over the region of feasible solutions shown at ...
- The graphs show regions of feasible solutions. Find the maximum and minimum values of each objective function....
- Find the maximum and minimum values of each objective function over the region of feasible solutions shown at ...
- In Exercises 1–4, find the value of the objective function at each corner of the graphed region. What is the m...
- In Exercises 1–4, find the value of the objective function at each corner of the graphed region. What is the m...
- In Exercises 5–14, an objective function and a system of linear inequalities representing constraints are give...
- In Exercises 5–14, an objective function and a system of linear inequalities representing constraints are give...
- In Exercises 5–14, an objective function and a system of linear inequalities representing constraints are give...
- In Exercises 5–14, an objective function and a system of linear inequalities representing constraints are give...