Ch. 3 - Polynomial and Rational Functions
Lial - College Algebra 13th Edition
Lial13th EditionCollege AlgebraISBN: 9780136881063Not the one you use?Change textbook
Chapter 4, Problem 4

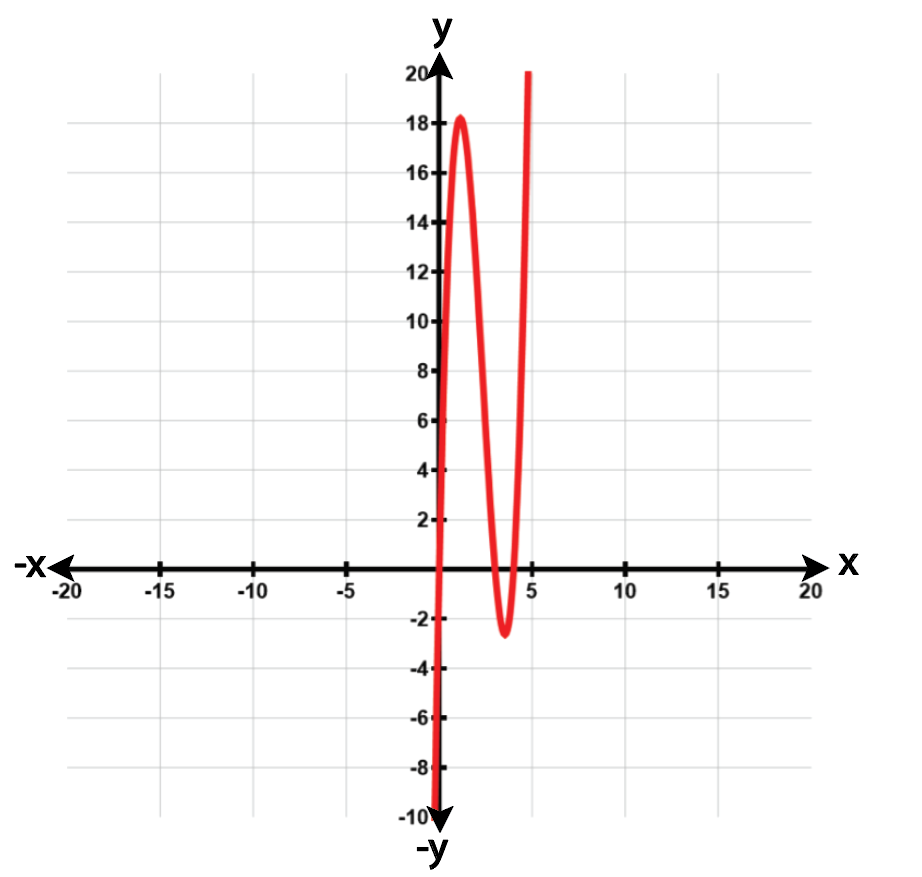
Use the graph to solve each equation or inequality. Use interval notation where appropriate. 7x(x - 1)(x - 2) < 0
Graph of the function 7x(x - 1)(x - 2) for solving linear inequalities.

Verified step by step guidance
1
Identify the roots of the function from the graph or the factored form of the function \$7x(x - 1)(x - 2)\(. The roots are the values of \)x\( where the function equals zero, which are \)x = 0\(, \)x = 1\(, and \)x = 2$.
These roots divide the number line into four intervals: \((-\infty, 0)\), \((0, 1)\), \((1, 2)\), and \((2, \infty)\).
Determine the sign of the function \$7x(x - 1)(x - 2)\( on each interval by either testing a point from each interval in the function or by analyzing the graph to see where the function is above or below the \)x$-axis.
Since the inequality is \$7x(x - 1)(x - 2) < 0\(, we are interested in the intervals where the function is negative (below the \)x$-axis).
Write the solution in interval notation by combining the intervals where the function is negative, excluding the points where the function equals zero because the inequality is strict (less than zero, not less than or equal to zero).

Verified video answer for a similar problem:

This video solution was recommended by our tutors as helpful for the problem above.
Video duration:
5m
Was this helpful?

Key Concepts

Here are the essential concepts you must grasp in order to answer the question correctly.

Polynomial Functions and Their Graphs

A polynomial function is an expression involving variables raised to whole-number exponents and their coefficients. The graph of a polynomial shows its behavior, including roots (x-intercepts) where the function equals zero. Understanding the shape and roots of the polynomial helps in solving inequalities by identifying intervals where the function is positive or negative.
Recommended video:
05:25
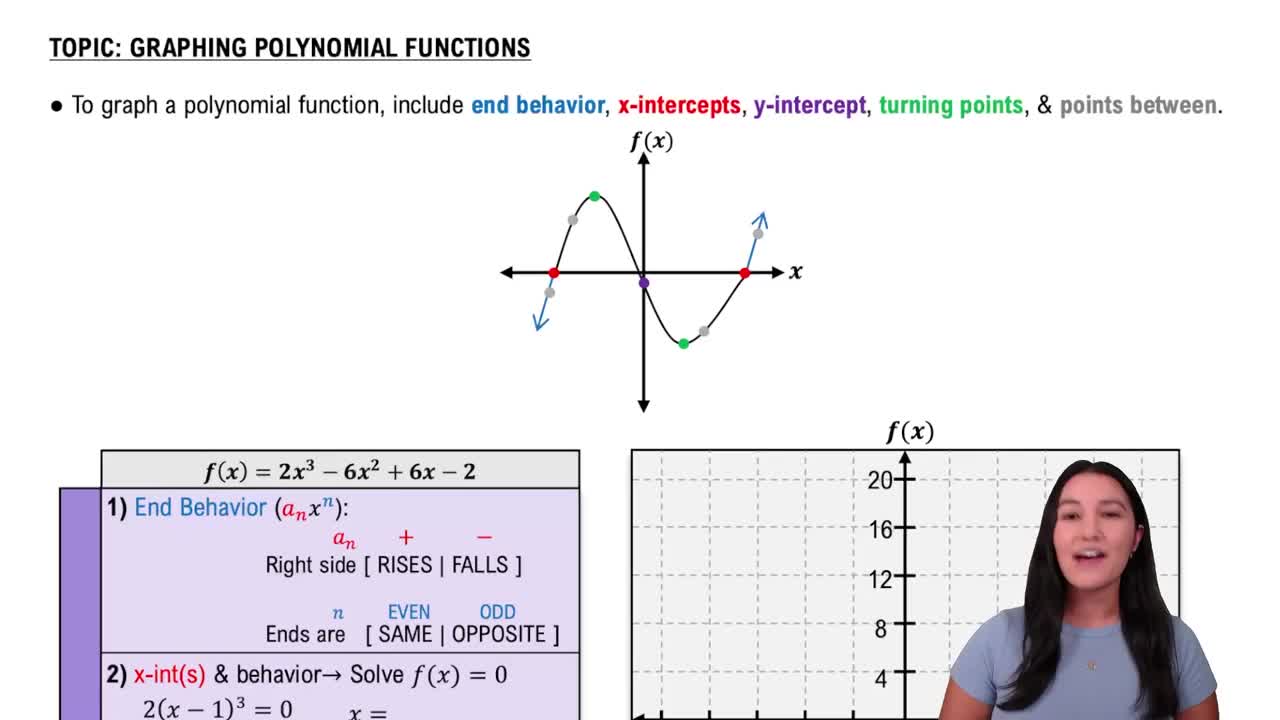
Graphing Polynomial Functions

Solving Polynomial Inequalities Using Graphs

To solve inequalities like 7x(x - 1)(x - 2) < 0, use the graph to find where the function is below the x-axis (negative values). The x-intercepts divide the number line into intervals; test points in each interval determine if the function is positive or negative there. The solution is the union of intervals where the inequality holds true.
Recommended video:
05:25
Graphing Polynomial Functions

Interval Notation

Interval notation is a concise way to represent sets of numbers between two endpoints. Parentheses () indicate that endpoints are not included, while brackets [] mean they are included. When solving inequalities, interval notation expresses the solution set clearly, showing all x-values that satisfy the inequality.
Recommended video:
05:18
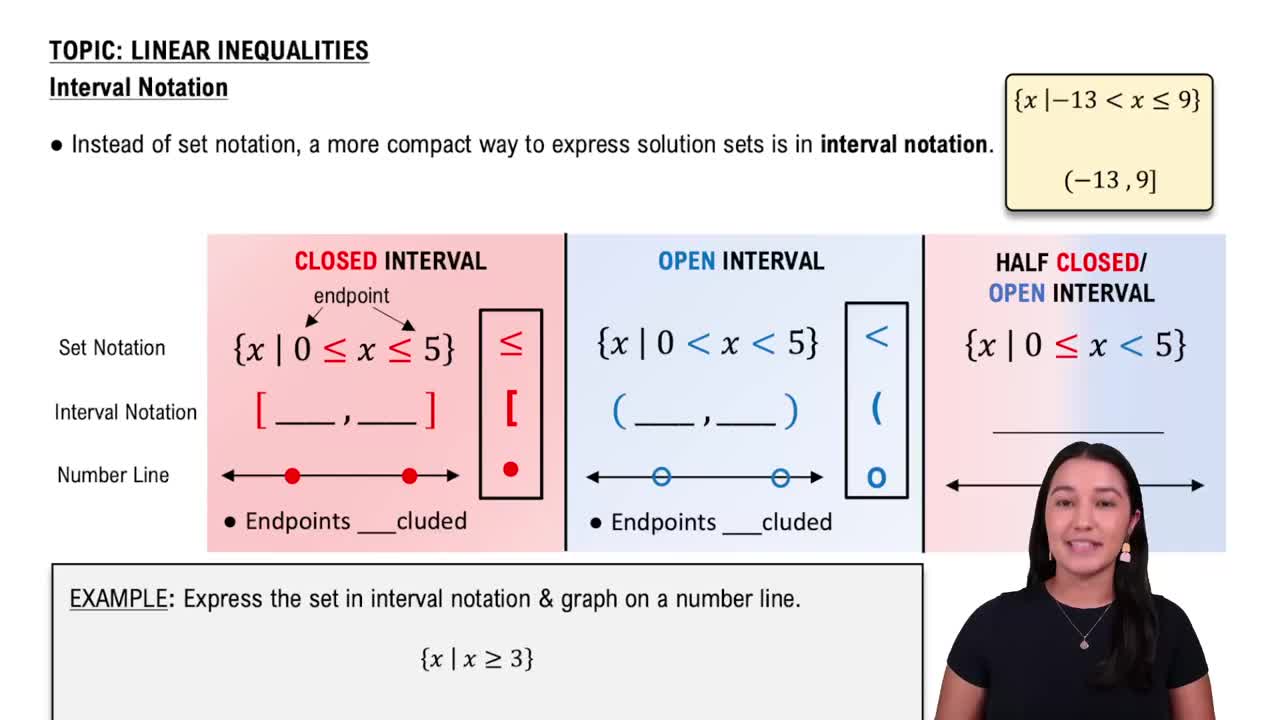
Interval Notation