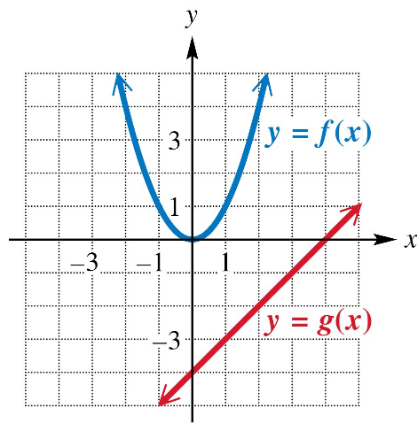
Use the graph to evaluate each expression. See Example 3(a). (ƒ/g)(1)
Verified step by step guidance
1
Identify the value of the functions f(x) and g(x) at x = 1 from the graph. Locate x = 1 on the x-axis and find the corresponding y-values for both f(x) (red parabola) and g(x) (blue line).
Read the y-value for f(1) from the red parabola. This is the height of the red curve at x = 1.
Read the y-value for g(1) from the blue line. This is the height of the blue line at x = 1.
Set up the expression (f/g)(1) which means \( \frac{f(1)}{g(1)} \).
Divide the value of f(1) by the value of g(1) to evaluate (f/g)(1). Remember to keep the values as they are without calculating the final numerical result.
Verified video answer for a similar problem:
This video solution was recommended by our tutors as helpful for the problem above
Video duration:
3m
Play a video:
0 Comments
Key Concepts
Here are the essential concepts you must grasp in order to answer the question correctly.
Function Evaluation from a Graph
Function evaluation involves finding the output value of a function for a given input. Using a graph, you locate the input value on the x-axis, then find the corresponding point on the function's curve to determine the output on the y-axis. This skill is essential for interpreting and solving problems involving functions visually.
The division of two functions, (ƒ/g)(x), means dividing the output of f(x) by the output of g(x) for the same input x. It is important to ensure g(x) ≠ 0 to avoid undefined expressions. This concept combines understanding of function operations and domain restrictions.
Reading and Interpreting Multiple Functions on a Graph
When multiple functions are graphed together, distinguishing between them by color or label is crucial. Understanding their shapes and behavior helps in evaluating expressions involving both functions, such as sums, differences, products, or quotients, by comparing their values at specific points.

 Verified step by step guidance
 4:26
4:26