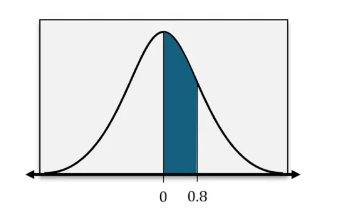
In the study of statistics, understanding continuous random variables and the standard normal distribution is crucial. The standard normal distribution is represented by a bell curve, characterized by its symmetry around the mean, which is zero. The z-score is a key concept here, as it quantifies how many standard deviations a data point is from the mean. To find probabilities associated with specific z-scores, we utilize a z-table, which provides cumulative probabilities for the standard normal distribution.
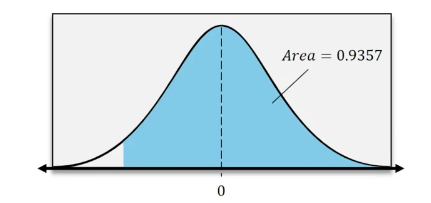
When tasked with finding the probability that a z-score is less than a given value, the process begins with sketching the normal curve and identifying the area of interest. For example, if we want to find the probability that z is less than -0.64, we would shade the area to the left of this z-score on the graph. Using the z-table, we locate the row for -0.6 and the column for 0.04, which intersect at the value 0.2611. This value represents the area under the curve to the left of -0.64, indicating that the probability of z being less than -0.64 is 0.2611.
Conversely, if we need to find the probability that z is greater than a certain value, such as 2.27, we again start by sketching the normal curve. This time, we are interested in the area to the right of the z-score. After locating 2.27 in the z-table, we find the cumulative probability of 0.9884, which represents the area to the left of 2.27. To find the area to the right, we subtract this value from 1, yielding a probability of 0.0116. This indicates that the probability of z being greater than 2.27 is 0.0116.
In summary, the z-table is an essential tool for determining probabilities associated with z-scores in the standard normal distribution. By visualizing the problem with graphs and carefully interpreting the values from the z-table, one can accurately find the probabilities of various outcomes in statistical analysis.