Ch. 25 - Phylogenies and the History of Life
Chapter 24, Problem 13

The vast majority of animals that ever existed are now extinct, but Tereza Jezkova and John Wiens wondered which variables were most important in driving the diversification of species that exist today. Why are there so many species in some phyla, such as Cnidaria (see photo), but so few in others, such as Ctenophora? Jezkova and Wiens used a type of graph called a linear regression to find correlations between variables such as the proportion of species per phylum with legs (on the y-axis) and the diversification rate per phylum (on the x-axis). Sketch a graph to show what a strong positive correlation between these two variables would look like and what the absence of a correlation would look like.

Verified step by step guidance
1
Step 1: Understand the problem. The problem is asking you to sketch a graph that shows a strong positive correlation and the absence of a correlation between two variables: the proportion of species per phylum with legs (y-axis) and the diversification rate per phylum (x-axis). A strong positive correlation means that as one variable increases, the other also increases. The absence of a correlation means that there is no relationship between the two variables.
Step 2: Sketch the first graph. Draw a graph with the x-axis labeled 'Diversification Rate per Phylum' and the y-axis labeled 'Proportion of Species per Phylum with Legs'. For a strong positive correlation, the points on the graph should form a line that slopes upwards from left to right. This indicates that as the diversification rate per phylum increases, the proportion of species per phylum with legs also increases.
Step 3: Sketch the second graph. Draw another graph with the same x and y axes. For the absence of a correlation, the points on the graph should be scattered with no clear pattern. This indicates that there is no relationship between the diversification rate per phylum and the proportion of species per phylum with legs.
Step 4: Interpret the graphs. The first graph suggests that phyla with higher diversification rates tend to have a higher proportion of species with legs. The second graph suggests that the diversification rate per phylum does not affect the proportion of species per phylum with legs.
Step 5: Remember that correlation does not imply causation. Even if there is a strong positive correlation between the two variables, it does not necessarily mean that a higher diversification rate causes a higher proportion of species with legs. Other factors could be involved.

Verified Solution

Video duration:
2m
This video solution was recommended by our tutors as helpful for the problem above.
Was this helpful?

Key Concepts

Here are the essential concepts you must grasp in order to answer the question correctly.

Species Diversification

Species diversification refers to the process by which new species arise and existing species evolve over time. Factors influencing diversification include environmental changes, ecological niches, and evolutionary pressures. Understanding why certain phyla, like Cnidaria, have high species diversity while others, like Ctenophora, have low diversity can provide insights into evolutionary biology and ecology.
Recommended video:
03:24
Biological Species Concept
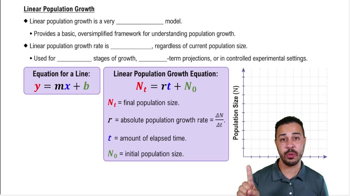
Linear Regression

Linear regression is a statistical method used to model the relationship between two variables by fitting a linear equation to observed data. In the context of the question, it helps identify correlations between the proportion of species with legs and the diversification rate per phylum. A strong positive correlation indicates that as one variable increases, the other does as well, while the absence of correlation suggests no predictable relationship between the two.
Recommended video:
Guided course
02:47
Linear Population Growth

Correlation vs. Causation

Correlation refers to a statistical relationship between two variables, indicating how they change together, while causation implies that one variable directly affects the other. In biological studies, it is crucial to distinguish between the two, as a strong correlation does not necessarily mean that one factor causes changes in another. Understanding this distinction is vital when interpreting the results of studies like those conducted by Jezkova and Wiens.
Recommended video:
Guided course
03:39
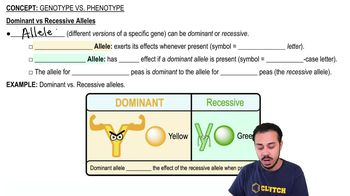
Dominant vs. Recessive Alleles
Related Practice
Textbook Question

Coral reefs are biodiverse ecosystems that provide food, income, coastal protection, and many other services to millions of people. Yet coral reefs are under threat from human impacts such as climate change—many corals cannot tolerate the warming ocean water and have suffered massive 'bleaching' events, which can be fatal. Researchers have discovered that some corals have the capacity to acclimatize to warmer water, while other corals do not. The researchers fear that because corals are long-lived colonial animals and thus evolve slowly, they may not be able to adapt to global warming fast enough to avoid extinction. Explain how the difference between acclimatize and adapt is important to the fate of corals.

387
views
Textbook Question

The vast majority of animals that ever existed are now extinct, but Tereza Jezkova and John Wiens wondered which variables were most important in driving the diversification of species that exist today. Why are there so many species in some phyla, such as Cnidaria (see photo), but so few in others, such as Ctenophora? Draw a horizontal axis to represent the number of species within phyla using a logarithmic scale (1, 10, 100, 1000 species, etc.). Then use Table 30.1 to map seven representative phyla from small to large at intervals of about an order of magnitude on this scale.

336
views
Textbook Question

The vast majority of animals that ever existed are now extinct, but Tereza Jezkova and John Wiens wondered which variables were most important in driving the diversification of species that exist today. Why are there so many species in some phyla, such as Cnidaria (see photo), but so few in others, such as Ctenophora? Based on your reading of this chapter, propose at least five traits that you think might have been most important in triggering diversification within phyla (examples: origin of hearing, origin of internal fertilization).

396
views
Textbook Question

The vast majority of animals that ever existed are now extinct, but Tereza Jezkova and John Wiens wondered which variables were most important in driving the diversification of species that exist today. Why are there so many species in some phyla, such as Cnidaria (see photo), but so few in others, such as Ctenophora? A sample of Jekova and Wiens' results is shown here. The R2 value represents the strength of the correlation (where 0.00 is lowest and 1.00 is highest). The P value represents the statistical significance. Which five traits look most important?

335
views
Textbook Question

Which traits do not correlate strongly with diversification rate within phyla, but are likely to have been important in the original diversification of animal phyla during the Cambrian? Select True or False for each trait. T/F presence of a head T/F mobile lifestyle T/F terrestrial lifestyle T/F bilateral symmetry

324
views
Textbook Question

The vast majority of animals that ever existed are now extinct, but Tereza Jezkova and John Wiens wondered which variables were most important in driving the diversification of species that exist today. Why are there so many species in some phyla, such as Cnidaria (see photo), but so few in others, such as Ctenophora? The researchers know that correlation does not equal causation. However, can the absence of a correlation enable you to reject a hypothesis of causation? How would the R2 values be different in a scenario where a single trait was important to diversification in many phyla versus a scenario where different traits were important to diversification in different phyla?

335
views