Ch. 14 - Mendel and the Gene
Chapter 14, Problem 8c

In garden peas, yellow seeds (Y) are dominant to green seeds (y), and inflated pods (I) are dominant to constricted pods (i). Suppose you have crossed YYII parents with yyii parents. Draw the F2 Punnett square. Based on this Punnett square, predict the expected phenotype(s) in the F2 generation and the expected frequency of each phenotype.

Verified step by step guidance
1
insert step 1
insert step 2
insert step 3
insert step 4
insert step 5

Verified Solution

Video duration:
1m
This video solution was recommended by our tutors as helpful for the problem above.
Was this helpful?

Key Concepts

Here are the essential concepts you must grasp in order to answer the question correctly.

Mendelian Genetics

Mendelian genetics is the study of how traits are inherited through generations based on the principles established by Gregor Mendel. It involves understanding dominant and recessive alleles, where dominant traits mask the expression of recessive ones. In this case, yellow seeds (Y) and inflated pods (I) are dominant traits, while green seeds (y) and constricted pods (i) are recessive.
Recommended video:
04:26
Mendelian and Population Genetics

Punnett Square

A Punnett square is a diagram used to predict the genotypic and phenotypic outcomes of a genetic cross. It organizes the possible combinations of alleles from each parent, allowing for the visualization of potential offspring traits. In this scenario, the F1 generation from crossing YYII and yyii will all be YyIi, and the F2 generation can be analyzed by crossing these F1 individuals.
Recommended video:
Guided course
01:37
Punnett Squares

Phenotypic Ratios

Phenotypic ratios represent the relative frequencies of different phenotypes in the offspring resulting from a genetic cross. After constructing the F2 Punnett square, one can determine the expected phenotypes and their ratios, such as the proportion of yellow vs. green seeds and inflated vs. constricted pods. This analysis helps predict how traits will be expressed in the next generation.
Recommended video:
Guided course
02:48
Genotypic vs. Phenotypic Ratio
Related Practice
Textbook Question

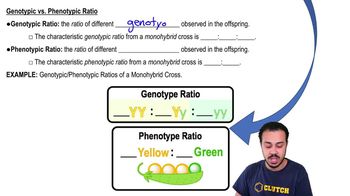
In peas, purple flowers are dominant to white. If a purple-flowered, heterozygous plant were crossed with a white-flowered plant, what is the expected ratio of genotypes and phenotypes among the F1 offspring? If two of the purple-flowered F1 offspring were randomly selected and crossed, what is the expected ratio of genotypes and phenotypes among the F2 offspring?

685
views
Textbook Question

In garden peas, yellow seeds (Y) are dominant to green seeds (y), and inflated pods (I) are dominant to constricted pods (i). Suppose you have crossed YYII parents with yyii parents. Draw the F1 Punnett square and predict the expected F1 phenotype(s).

538
views
Textbook Question

In garden peas, yellow seeds (Y) are dominant to green seeds (y), and inflated pods (I) are dominant to constricted pods (i). Suppose you have crossed YYII parents with yyii parents. List the genotype(s) of gametes produced by F1 individuals.

661
views
Textbook Question

In parakeets, two autosomal genes that are located on different chromosomes control the production of feather pigment. Gene B codes for an enzyme that is required for the synthesis of a blue pigment, and gene Y codes for an enzyme required for the synthesis of a yellow pigment. Green results from a mixture of yellow and blue pigments, and recessive mutations that prevent production of either pigment are known for both genes. Suppose that a breeder has two green parakeets and mates them. The offspring are green, blue, yellow, and albino (unpigmented). Based on this observation, what are the genotypes of the green parents? What genotypes produce each color in the offspring? What fraction of the progeny should exhibit each type of color?

456
views
Textbook Question

Imagine repeating the experiment on epigenetic inheritance that is shown in Figure 19.6. You measure the amount of radioactive uridine (U) incorporated into Hnf4a mRNA in counts per minute (cpm) to determine the level of Hnf4a gene transcription in rats born to mothers fed either a normal diet or a low-protein diet. The results are 11,478 cpm for the normal diet and 7368 cpm for the low-protein diet. For this problem, your task is to prepare a graph similar to the one at the bottom of Figure 19.6 that shows the normalized results for the low-protein diet relative to the normal diet. Normalizing values means that the value obtained from one condition is expressed as 1.0 (the norm; the normal diet in this case) and the values obtained from any other conditions (low-protein diet in this case) are expressed as decimal values relative to the norm.

471
views
Textbook Question

The smooth feathers on the back of the neck in pigeons can be reversed by a mutation to produce a 'crested' appearance in which feathers form a distinctive spike at the back of the head. A pigeon breeder examined offspring produced by a single pair of non-crested birds and recorded the following: 22 non-crested and 7 crested. She then made a series of crosses using offspring from the first cross. When she crossed two of the crested birds, all 20 of the offspring were crested. When she crossed a non-crested bird with a crested bird, 7 offspring were non-crested and 6 were crested. For these three crosses, provide genotypes for parents and offspring that are consistent with these results.

535
views