Here are the essential concepts you must grasp in order to answer the question correctly.
Amplitude
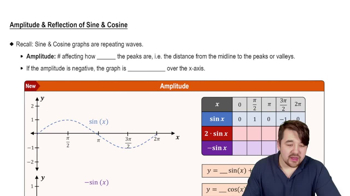
Amplitude refers to the maximum distance a wave reaches from its central axis or equilibrium position. In the context of sine functions, it is determined by the coefficient in front of the sine term. For the function y = -3 sin 2πx, the amplitude is 3, indicating that the wave oscillates 3 units above and below the central axis.
Recommended video:
Amplitude and Reflection of Sine and Cosine
Period
The period of a trigonometric function is the length of one complete cycle of the wave. For sine functions, the period can be calculated using the formula 2π divided by the coefficient of x inside the sine function. In this case, the period of y = -3 sin 2πx is 1, meaning the function completes one full cycle over the interval from x = 0 to x = 1.
Recommended video:
Period of Sine and Cosine Functions
Graphing Sine Functions
Graphing sine functions involves plotting the values of the function over a specified interval. For y = -3 sin 2πx, the graph will oscillate between -3 and 3, with the wave starting at the central axis, reaching its maximum at x = 0.25, returning to the axis at x = 0.5, reaching its minimum at x = 0.75, and completing the cycle at x = 1.
Recommended video:
Graph of Sine and Cosine Function
 Blitzer 3rd Edition
 Ch. 2 - Graphs of the Trigonometric Functions; Inverse Trigonometric Functions
 Problem 13
 Verified step by step guidance


