In Exercises 7–16, determine the amplitude and period of each function. Then graph one period of the function.
y = 3 sin 1/2 x
Verified step by step guidance
1
Identify the general form of the sine function, which is \( y = a \sin(bx + c) + d \). In this case, \( y = 3 \sin\left(\frac{1}{2}x\right) \).
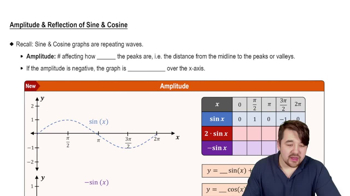
Determine the amplitude of the function. The amplitude is the absolute value of \( a \), which is the coefficient in front of the sine function. Here, \( a = 3 \), so the amplitude is \( |3| = 3 \).
Find the period of the function. The period of a sine function is given by \( \frac{2\pi}{b} \), where \( b \) is the coefficient of \( x \) inside the sine function. Here, \( b = \frac{1}{2} \), so the period is \( \frac{2\pi}{\frac{1}{2}} = 4\pi \).
Graph one period of the function. Start at \( x = 0 \) and plot points at key intervals: \( x = 0 \), \( x = \pi \), \( x = 2\pi \), \( x = 3\pi \), and \( x = 4\pi \). The corresponding \( y \)-values will be \( 0 \), \( 3 \), \( 0 \), \( -3 \), and \( 0 \) respectively.
Draw the sine curve through these points, ensuring it reaches the maximum and minimum values at the appropriate intervals, completing one full cycle of the sine wave.
Verified Solution
Video duration:
5m
Play a video:
This video solution was recommended by our tutors as helpful for the problem above.
Was this helpful?
Key Concepts
Here are the essential concepts you must grasp in order to answer the question correctly.
Amplitude
Amplitude refers to the maximum distance a wave reaches from its central axis or equilibrium position. In the context of sine functions, it is determined by the coefficient in front of the sine term. For the function y = 3 sin(1/2 x), the amplitude is 3, indicating that the wave oscillates between 3 and -3.
The period of a trigonometric function is the length of one complete cycle of the wave. For sine functions, the period can be calculated using the formula P = 2π / |b|, where b is the coefficient of x. In the function y = 3 sin(1/2 x), the coefficient is 1/2, resulting in a period of 4π, meaning the function repeats every 4π units along the x-axis.
Graphing trigonometric functions involves plotting the function's values over a specified interval to visualize its behavior. For y = 3 sin(1/2 x), one period can be graphed from 0 to 4π, showing the wave's oscillation between its amplitude limits. Understanding the amplitude and period is crucial for accurately representing the function's shape and characteristics on a graph.