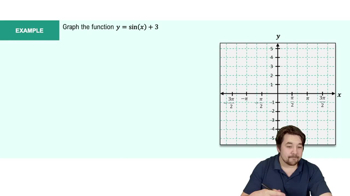
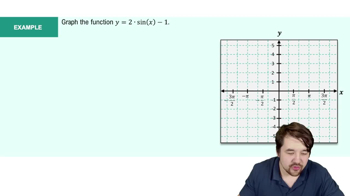
Multiple ChoiceSketch the function y=cos(x)−1y=\cos\left(x\right)-1y=cos(x)−1 on the graph below.154views
Multiple ChoiceDetermine the value of y=sin(−π2)+50y=\sin\left(-\frac{\pi}{2}\right)+50y=sin(−2π)+50 without using a calculator or the unit circle.150views3rank
Multiple ChoiceDetermine the value of y=−2⋅sin(−3π2)+10y=-2\cdot\sin\left(-\frac{3\pi}{2}\right)+10y=−2⋅sin(−23π)+10 without using a calculator or the unit circle.141views2rank
Multiple ChoiceGiven below is the graph of the function y=sin(bx)y=\sin\left(bx\right)y=sin(bx). Determine the correct value for b.189views
Multiple ChoiceThe Period for the function y=cos(bx)y=\cos\left(bx\right)y=cos(bx) is T=20πT=20\piT=20π. Determine the correct value of b.147views1rank
Textbook QuestionIn Exercises 1–6, determine the amplitude of each function. Then graph the function and y = sin x in the same rectangular coordinate system for 0 ≤ x ≤ 2π. y = 4 sin x313views
Textbook QuestionIn Exercises 1–6, determine the amplitude of each function. Then graph the function and y = sin x in the same rectangular coordinate system for 0 ≤ x ≤ 2π. y = 1/3 sin x224views
Textbook QuestionAn object in simple harmonic motion has position function s(t), in inches, from an equilibrium point, as follows, where t is time in seconds.𝒮(t) = 5 cos 2tWhat is the amplitude of this motion?150views
Textbook QuestionFill in the blank(s) to correctly complete each sentence.The graph of y = sin (x + π/4) is obtained by shifting the graph of y = sin x ______ unit(s) to the ________ (right/left).133views
Textbook QuestionFor each function, give the amplitude, period, vertical translation, and phase shift, as applicable.y = 3 - ¼ cos ⅔ x139views
Textbook QuestionMatch each function with its graph in choices A–I. (One choice will not be used.)y = cos (x - π/4)A. <IMAGE> B. <IMAGE> C. <IMAGE>D. <IMAGE> E. <IMAGE> F. <IMAGE>G. <IMAGE> H. <IMAGE> I. <IMAGE>147views
Textbook QuestionFor each function, give the amplitude, period, vertical translation, and phase shift, as applicable.y = 3 cos (x + π/2)149views
Textbook QuestionFor each function, give the amplitude, period, vertical translation, and phase shift, as applicable.y = -sin (x - 3π/4)137views
Textbook QuestionGraph each function over the interval [-2π, 2π]. Give the amplitude. See Example 1.y = 2 cos x203views
Textbook QuestionGraph each function over the interval [-2π, 2π]. Give the amplitude. See Example 1.y = ⅔ sin x357views1comments
Textbook QuestionMatch each function with its graph in choices A–I. (One choice will not be used.) y = -1 + cos xA. <IMAGE> B. <IMAGE> C. <IMAGE>D. <IMAGE> E. <IMAGE> F. <IMAGE>G. <IMAGE> H. <IMAGE> I. <IMAGE>215views
Textbook QuestionGraph each function over the interval [-2π, 2π]. Give the amplitude. See Example 1.y = -2 sin x198views
Textbook QuestionMatch each function in Column I with the appropriate description in Column II. I y = 3 sin(2x - 4) IIA. amplitude = 2, period = π/2, phase shift = ¾B. amplitude = 3, period = π, phase shift = 2C. amplitude = 4, period = 2π/3, phase shift = ⅔D. amplitude = 2, period = 2π/3, phase shift = 4⁄3144views
Textbook QuestionFill in the blank(s) to correctly complete each sentence.The graph of y = cos (x - π/6) is obtained by shifting the graph of y = cos x ______ unit(s) to the ________ (right/left).162views
Textbook QuestionAn object in simple harmonic motion has position function s(t), in inches, from an equilibrium point, as follows, where t is time in seconds.𝒮(t) = 5 cos 2tWhat is the period of this motion?142views
Textbook QuestionMatch each function in Column I with the appropriate description in Column II.Iy = -4 sin(3x - 2)IIA. amplitude = 2, period = π/2, phase shift = ¾B. amplitude = 3, period = π, phase shift = 2C. amplitude = 4, period = 2π/3, phase shift = ⅔D. amplitude = 2, period = 2π/3, phase shift = 4⁄3147views
Textbook QuestionGraph each function over a two-period interval. Give the period and amplitude. See Examples 2–5.y = sin ⅔ x162views
Textbook QuestionGraph each function over a two-period interval. Give the period and amplitude. See Examples 2–5.y = sin 3x157views
Textbook QuestionEach function graphed is of the form y = c + cos x, y = c + sin x, y = cos(x - d), or y = sin(x - d), where d is the least possible positive value. Determine an equation of the graph.<IMAGE>159views
Textbook QuestionEach function graphed is of the form y = c + cos x, y = c + sin x, y = cos(x - d), or y = sin(x - d), where d is the least possible positive value. Determine an equation of the graph.<IMAGE>235views
Textbook QuestionGraph each function over a two-period interval. Give the period and amplitude. See Examples 2–5.y = 2 sin ¼ x300views
Textbook QuestionEach function graphed is of the form y = c + cos x, y = c + sin x, y = cos(x - d), or y = sin(x - d), where d is the least possible positive value. Determine an equation of the graph.<IMAGE>148views
Textbook QuestionAn object in simple harmonic motion has position function s(t), in inches, from an equilibrium point, as follows, where t is time in seconds.𝒮(t) = 5 cos 2tWhat is the frequency?165views
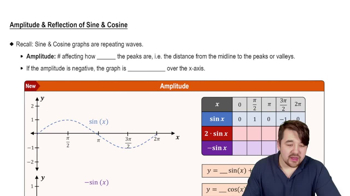
Textbook QuestionFill in the blank(s) to correctly complete each sentence.The graph of y = 4 sin x is obtained by stretching the graph of y = sin x vertically by a factor of ________.149views
Textbook QuestionGraph each function over a two-period interval. Give the period and amplitude. See Examples 2–5.y = -2 cos 3x177views
Textbook QuestionFor each function, give the amplitude, period, vertical translation, and phase shift, as applicable.y = 2 sin (x + π)146views
Textbook QuestionFor each function, give the amplitude, period, vertical translation, and phase shift, as applicable.y = -¼ cos (½ x + π/2)148views
Textbook QuestionDecide whether each statement is true or false. If false, explain why.The graph of y = sec x in Figure 37 suggests that sec(-x) = sec x for all x in the domain of sec x.140views
Textbook QuestionGraph each function over a two-period interval. Give the period and amplitude. See Examples 2–5.y = -2 sin 2 πx209views
Textbook QuestionFor each function, give the amplitude, period, vertical translation, and phase shift, as applicable.y = 3 cos [π/2 (x - ½)]157views
Textbook QuestionGraph each function over a two-period interval. Give the period and amplitude. See Examples 2–5.y = ½ cos π x 2244views
Textbook QuestionFor each function, give the amplitude, period, vertical translation, and phase shift, as applicable.y = 2 - sin(3x - π/5)199views
Textbook QuestionGraph each function over a two-period interval. Give the period and amplitude. See Examples 2–5.y = π sin πx185views
Textbook QuestionFill in the blank(s) to correctly complete each sentence.The graph of y = -3 sin x is obtained by stretching the graph of y = sin x by a factor of ________ and reflecting across the ________-axis.166views
Textbook QuestionDetermine an equation of the form y = a cos bx or y = a sin bx, where b > 0, for the given graph. See Example 6.<IMAGE>151views
Textbook QuestionDetermine an equation of the form y = a cos bx or y = a sin bx, where b > 0, for the given graph. See Example 6.<IMAGE>285views
Textbook QuestionDetermine an equation of the form y = a cos bx or y = a sin bx, where b > 0, for the given graph. See Example 6.<IMAGE>205views
Textbook QuestionDetermine the simplest form of an equation for each graph. Choose b > 0, and include no phase shifts.<IMAGE>154views
Textbook QuestionDetermine an equation of the form y = a cos bx or y = a sin bx, where b > 0, for the given graph. See Example 6.<IMAGE>169views
Textbook QuestionDetermine the simplest form of an equation for each graph. Choose b > 0, and include no phase shifts.<IMAGE>158views
Textbook QuestionDetermine an equation of the form y = a cos bx or y = a sin bx, where b > 0, for the given graph. See Example 6.<IMAGE>223views
Textbook QuestionGraph each function over a one-period interval. See Example 3.y = (3/2) sin [2(x + π/4)]157views
Textbook QuestionDetermine an equation of the form y = a cos bx or y = a sin bx, where b > 0, for the given graph. See Example 6.<IMAGE>193views
Textbook QuestionFor each function, give the amplitude, period, vertical translation, and phase shift, as applicable.y = 2 sin 2x146views
Textbook QuestionFill in the blank(s) to correctly complete each sentence.The graph of y = 6 + 3 sin x is obtained by shifting the graph of y = 3 sin x ________ unit(s) __________ (up/down).159views
Textbook QuestionGraph each function over a two-period interval. See Example 4.y = -3 + 2 sin x145views
Textbook QuestionGraph each function over a two-period interval. See Example 4.y = -1 - 2 cos 5x156views
Textbook QuestionFill in the blank(s) to correctly complete each sentence.The graph of y = -5 + 2 cos x is obtained by shifting the graph of y = 2 cos x ________ unit(s) __________ (up/down).141views
Textbook QuestionFor each function, give the amplitude, period, vertical translation, and phase shift, as applicable.y = -½ cos 3x169views
Textbook QuestionFill in the blank(s) to correctly complete each sentence.The graph of y = 3 + 5 cos (x + π/5) is obtained by shifting the graph of y = cos x horizontally ________ unit(s) to the __________, (right/left) stretching it vertically by a factor of ________, and then shifting it vertically ________ unit(s) __________. (up/down)170views
Textbook QuestionFor each function, give the amplitude, period, vertical translation, and phase shift, as applicable.y = 2 sin 5x169views
Textbook QuestionFill in the blank(s) to correctly complete each sentence.The graph of y = -2 + 3 cos (x - π/6) is obtained by shifting the graph of y = cos x horizontally ________ unit(s) to the __________, (right/left) stretching it vertically by a factor of ________, and then shifting it vertically ________ unit(s) __________. (up/down)138views
Textbook QuestionMatch each function with its graph in choices A–I. (One choice will not be used.)y = sin (x - π/4)A. <IMAGE> B. <IMAGE> C. <IMAGE>D. <IMAGE> E. <IMAGE> F. <IMAGE>G. <IMAGE> H. <IMAGE> I. <IMAGE>170views
Textbook QuestionFor each function, give the amplitude, period, vertical translation, and phase shift, as applicable.y = 1 + 2 sin ¼ x155views
Textbook QuestionIn Exercises 1–6, determine the amplitude of each function. Then graph the function and y = sin x in the same rectangular coordinate system for 0 ≤ x ≤ 2π. y = -3 sin x420views
Textbook QuestionIn Exercises 7–16, determine the amplitude and period of each function. Then graph one period of the function. y = 3 sin 1/2 x278views
Textbook QuestionIn Exercises 7–16, determine the amplitude and period of each function. Then graph one period of the function. y = -3 sin 2πx294views
Textbook QuestionIn Exercises 12–13, use a vertical shift to graph one period of the function. y = 2 cos 1/3 x − 2233views
Textbook QuestionIn Exercises 7–16, determine the amplitude and period of each function. Then graph one period of the function. y = -sin 2/3 x241views
Textbook QuestionIn Exercises 14–15, use the method of adding y-coordinates to graph each function for 0 ≤ x ≤ 2π. y = sin x + cos 1/2 x176views
Textbook QuestionIn Exercises 17–30, determine the amplitude, period, and phase shift of each function. Then graph one period of the function. y = sin(x − π)315views
Textbook QuestionIn Exercises 17–30, determine the amplitude, period, and phase shift of each function. Then graph one period of the function. y = 3 sin(2x − π)305views
Textbook QuestionIn Exercises 17–30, determine the amplitude, period, and phase shift of each function. Then graph one period of the function. y = 1/2 sin(x + π/2)231views
Textbook QuestionIn Exercises 17–30, determine the amplitude, period, and phase shift of each function. Then graph one period of the function. y = −2 sin(2x + π/2)526views
Textbook QuestionConcept Check Plot each point, and then plot the points that are symmetric to the given point with point with respect to the (a) x-axis (5, -3)149views
Textbook QuestionConcept Check Plot each point, and then plot the points that are symmetric to the given point with point with respect to the (b) y-axis (5, -3)146views
Textbook QuestionConcept Check Plot each point, and then plot the points that are symmetric to the given point with point with respect to the (c) origin. (5, -3)125views
Textbook QuestionConcept Check Plot each point, and then plot the points that are symmetric to the given point with point with respect to the (a) x-axis (-4, -2)138views
Textbook QuestionConcept Check Plot each point, and then plot the points that are symmetric to the given point with point with respect to the (b) y-axis. (-4, -2)126views
Textbook QuestionConcept Check Plot each point, and then plot the points that are symmetric to the given point with point with respect to the (c) origin. (-4, -2)127views
Textbook QuestionDetermine whether each function is even, odd, or neither. See Example 5. ƒ(x) = -x³ + 2x149views
Textbook QuestionDetermine whether each function is even, odd, or neither. See Example 5. ƒ(x) = 0.5x⁴ - 2x² + 6123views
Textbook QuestionIn Exercises 53–60, use a vertical shift to graph one period of the function. y = sin x + 2199views
Textbook QuestionDetermine whether each function is even, odd, or neither. See Example 5. ƒ(x) = x³ - x + 9263views
Textbook QuestionDetermine whether each function is even, odd, or neither. See Example 5. 1 ƒ(x) = x + —— x⁵118views
Textbook QuestionIn Exercises 53–60, use a vertical shift to graph one period of the function. y = cos x + 3188views
Textbook QuestionIn Exercises 53–60, use a vertical shift to graph one period of the function. y = −3 sin 2πx + 2226views
Textbook QuestionIn Exercises 61–66, use the method of adding y-coordinates to graph each function for 0 ≤ x ≤ 2π. y = 3 cos x + sin x162views
Textbook QuestionIn Exercises 61–66, use the method of adding y-coordinates to graph each function for 0 ≤ x ≤ 2π. y = cos x + cos 2x215views
Textbook QuestionIn Exercises 61–66, use the method of adding y-coordinates to graph each function for 0 ≤ x ≤ 2π. y = cos x + sin 2x188views
Textbook QuestionIn Exercises 67–68, use the method of adding y-coordinates to graph each function for 0 ≤ x ≤ 4. y = cos πx + sin π/2 x166views
Textbook QuestionIn Exercises 79–82, graph f, g, and h in the same rectangular coordinate system for 0 ≤ x ≤ 2π. Obtain the graph of h by adding or subtracting the corresponding y-coordinates on the graphs of f and g. f(x) = 2 cos x, g(x) = cos 2x, h(x) = (f + g)(x)179views
Textbook QuestionIn Exercises 79–82, graph f, g, and h in the same rectangular coordinate system for 0 ≤ x ≤ 2π. Obtain the graph of h by adding or subtracting the corresponding y-coordinates on the graphs of f and g. f(x) = cos x, g(x) = sin 2x, h(x) = (f − g)(x)179views