Here are the essential concepts you must grasp in order to answer the question correctly.
Velocity as a Function of Time
Velocity is defined as the rate of change of position with respect to time. In this case, the car's velocity is expressed as a function of time, v_x(t) = α + βt^2, where α represents the initial velocity and β is a coefficient that affects how velocity changes over time. Understanding this function is crucial for analyzing the car's motion and predicting its behavior at different time intervals.
Recommended video:
Velocity-Time Graphs & Acceleration
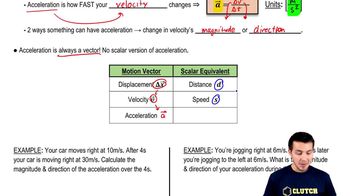
Acceleration
Acceleration is the rate of change of velocity with respect to time. It can be derived from the velocity function by taking its derivative. For the given velocity function, the acceleration a_x(t) can be calculated as a_x(t) = d(v_x(t))/dt, which will yield a linear function in this case, indicating how the car's velocity changes over time. This concept is essential for understanding the dynamics of the car's motion.
Recommended video:
Graphing Motion
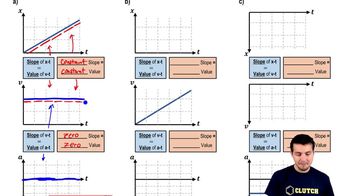
Graphing motion involves plotting the relationships between time, velocity, and acceleration on a coordinate system. The v_x-t graph shows how the car's velocity changes over time, while the a_x-t graph illustrates how acceleration varies. These visual representations help in analyzing the motion's characteristics, such as identifying periods of constant velocity or acceleration, and are fundamental tools in physics for interpreting motion.
Recommended video:
Graphing Position, Velocity, and Acceleration Graphs
 Verified step by step guidance
 This video solution was recommended by our tutors as helpful for the problem above.
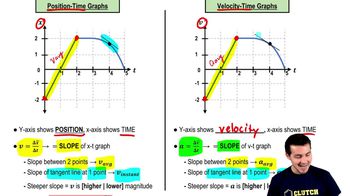
 05:59
05:59