Table of contents
- 1. Introduction to Macroeconomics2h 13m
- 2. Introductory Economic Models1h 15m
- Production Possibilities Frontier (PPF) - Introduction and Productive Efficiency19m
- PPF - Increasing Marginal Opportunity Costs and Allocative Efficiency12m
- PPF - Outward Shifts9m
- PPF - Comparative Advantage and Absolute Advantage14m
- PPF - Comparative Advantage and Trade14m
- PPF - The Price of the Trade4m
- 3. Supply and Demand3h 28m
- Introduction to Supply and Demand5m
- The Basics of Demand7m
- Individual Demand and Market Demand3m
- Shifting Demand39m
- The Basics of Supply3m
- Individual Supply and Market Supply6m
- Shifting Supply29m
- Overview of Supply and Demand Shifts9m
- Supply and Demand Together: Equilibrium, Shortage, and Surplus6m
- Supply and Demand Together: One-sided Shifts20m
- Supply and Demand Together: Both Shift34m
- Supply and Demand: Quantitative Analysis41m
- 4. Elasticity2h 36m
- Percentage Change and Price Elasticity of Demand19m
- Elasticity and the Midpoint Method21m
- Price Elasticity of Demand on a Graph12m
- Determinants of Price Elasticity of Demand7m
- Total Revenue Test14m
- Total Revenue Along a Linear Demand Curve15m
- Income Elasticity of Demand24m
- Cross-Price Elasticity of Demand12m
- Price Elasticity of Supply13m
- Price Elasticity of Supply on a Graph4m
- Elasticity Summary10m
- 5. Consumer and Producer Surplus; Price Ceilings and Price Floors3h 19m
- Willingness to Pay and Consumer Surplus19m
- Willingness to Sell and Producer Surplus13m
- Economic Surplus and Efficiency19m
- Quantitative Analysis of Consumer and Producer Surplus at Equilibrium29m
- Price Ceilings, Price Floors, and Black Markets39m
- Quantitative Analysis of Price Ceilings and Price Floors: Finding Points21m
- Quantitative Analysis of Price Ceilings and Price Floors: Finding Areas55m
- 6. Introduction to Taxes and Subsidies1h 53m
- 7. Externalities56m
- 8. The Types of Goods1h 6m
- 9. International Trade1h 21m
- 10. The Costs of Production2h 35m
- 11. Perfect Competition2h 26m
- Introduction to the Four Market Models2m
- Characteristics of Perfect Competition6m
- Revenue in Perfect Competition14m
- Perfect Competition Profit on the Graph21m
- Short Run Shutdown Decision35m
- Long Run Entry and Exit Decision18m
- Individual Supply Curve in the Short Run and Long Run6m
- Market Supply Curve in the Short Run and Long Run9m
- Long Run Equilibrium12m
- Perfect Competition and Efficiency15m
- Four Market Model Summary: Perfect Competition5m
- 12. Monopoly2h 13m
- Characteristics of Monopoly21m
- Monopoly Revenue12m
- Monopoly Profit on the Graph16m
- Monopoly Efficiency and Deadweight Loss20m
- Price Discrimination22m
- Antitrust Laws and Government Regulation of Monopolies11m
- Mergers and the Herfindahl-Hirschman Index (HHI)17m
- Four Firm Concentration Ratio6m
- Four Market Model Summary: Monopoly4m
- 13. Monopolistic Competition1h 9m
- 14. Oligopoly1h 26m
- 15. Markets for the Factors of Production1h 26m
- 16. Income Inequality and Poverty36m
- 17. Asymmetric Information, Voting, and Public Choice39m
- 18. Consumer Choice and Behavioral Economics1h 16m
2. Introductory Economic Models
PPF - Increasing Marginal Opportunity Costs and Allocative Efficiency
Multiple Choice
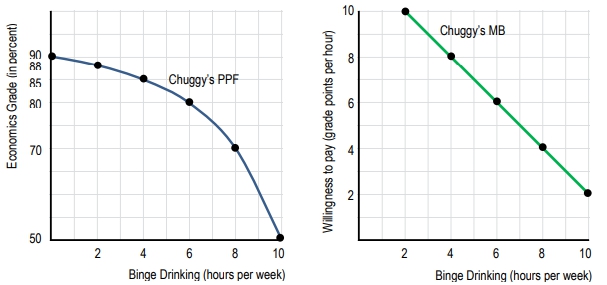
Chuggy wants to earn a high grade in his microeconomics class, but also loves going to parties and binge drinking. The first graph illustrates Chuggy's PPF. The second graph denotes his MB curve from binge drinking.

What is Chuggy's marginal cost of binge drinking if he parties for three hours a week?
A
1 percentage point
B
1.5 percentage points
C
2 percentage points
D
3 percentage points
E
5 percentage points
2 Comments
Verified step by step guidance1
Identify the point on Chuggy's PPF graph where binge drinking is 3 hours per week. This corresponds to an economics grade of 85 percent.
Determine the change in the economics grade when binge drinking increases from 3 to 4 hours per week. On the PPF graph, this change is from 85 percent to 82 percent.
Calculate the marginal cost of binge drinking in terms of grade points lost. The marginal cost is the change in grade points, which is 85 - 82 = 3 percentage points.
Understand that the marginal cost represents the opportunity cost of increasing binge drinking by one additional hour, which is the loss in grade points.
Compare the calculated marginal cost with the given options to identify the correct answer. The marginal cost of 3 percentage points matches one of the provided options.
Related Videos
Related Practice
Multiple Choice
In the context of the production possibilities frontier (PPF), what does increasing marginal opportunity costs mean?
147
views