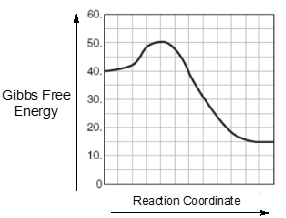
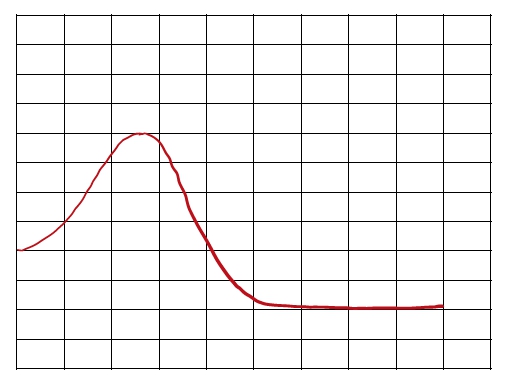
An energy diagram represents a curved plot on a graph that illustrates the energies of reactants, products, and transition state as a reaction occurs. We're going to say here that our reactants, abbreviated as "r", are found on the left in the beginning. So here, if we take a look at this energy diagram, at the very beginning of the curve is this box which represents our reactants. We're going to say our products, which we represent by "p", are found right at the end. So here at the very end of this curve, we have this last box here. This represents our products. Then we're going to say our transition state, which we're going to abbreviate as "ts". This equals the max energy structure along a reaction coordinate between reactants and products. So the top of the curve, that is our transition state, so "ts". Sometimes it's referred to as also the activated complex. Your transition state, activated complex are the same thing.
We're going to say our reaction coordinate is just the progress of a reaction that lies along the x-axis. So here our y-axis is looking at the change in energy starting out at 80 kilojoules and going up all the way up to 200, and this is on our y-axis. Our x-axis is here, and this is our reaction progression. So, this is our reaction coordinate. It's looking at the lifetime or lifespan of the reaction as we go from reactants in the beginning to products at the end, and everything in between.
Now we're going to say here that our activation energy, also referred to as our energy barrier, abbreviated as Ea. This is just the minimum energy required for a reaction to occur. So we're going to say here that the height, the difference in height to the reactive line, that represents our activation energy or energy barrier. So when we're looking at the very top of the hill to down here where the reactants are, that is our activation energy. Just keep in mind these are the most fundamental and most important parts of any energy diagram that you'll come face to face with.


