Ch. 4 - Gene Interaction
Chapter 4, Problem 6

Calculate the mean, variance, and standard deviation for a sample of turkeys weighed at 8 weeks of age that have the following weights in ounces: 161, 172, 155, 173, 149, 177, 156, 174, 158, 162, 171, 181.

Verified step by step guidance
1
span>Step 1: Calculate the mean (average) of the sample. Add all the weights together and divide by the number of weights.</span
span>Step 2: Calculate the deviations from the mean for each weight. Subtract the mean from each individual weight.</span
span>Step 3: Square each of the deviations calculated in Step 2 to eliminate negative values and emphasize larger deviations.</span
span>Step 4: Calculate the variance by finding the average of these squared deviations. Add all the squared deviations together and divide by the number of weights minus one (n-1) for a sample.</span
span>Step 5: Calculate the standard deviation by taking the square root of the variance. This provides a measure of the spread of the weights in the same units as the original data.</span

Verified video answer for a similar problem:

This video solution was recommended by our tutors as helpful for the problem above.
Video duration:
1m
Was this helpful?

Key Concepts

Here are the essential concepts you must grasp in order to answer the question correctly.

Mean

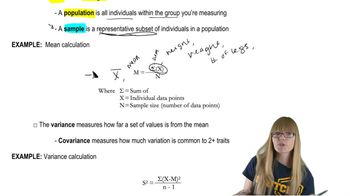
The mean is the average value of a set of numbers, calculated by summing all the values and dividing by the total number of values. In this case, to find the mean weight of the turkeys, you would add all the weights together and divide by the number of turkeys in the sample.
Recommended video:
Guided course
11:10
Mathematical Measurements

Variance

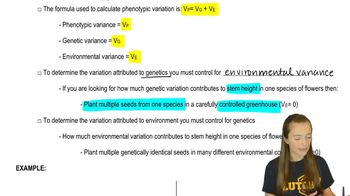
Variance measures the spread of a set of values around the mean. It is calculated by taking the average of the squared differences between each value and the mean. A higher variance indicates that the weights of the turkeys are more spread out from the mean, while a lower variance suggests they are closer to the mean.
Recommended video:
Guided course
08:34
Analyzing Trait Variance

Standard Deviation

Standard deviation is the square root of the variance and provides a measure of the average distance of each data point from the mean. It is a useful statistic for understanding the dispersion of weights in the sample of turkeys, with a smaller standard deviation indicating that the weights are closely clustered around the mean.
Recommended video:
Guided course
11:10
Mathematical Measurements
Related Practice
Textbook Question

In Drosophila, the map positions of genes are given in map units numbering from one end of a chromosome to the other. The X chromosome of Drosophila is 66 m.u. long. The X-linked gene for body color—with two alleles, y⁺ for gray body and y for yellow body—resides at one end of the chromosome at map position 0.0. A nearby locus for eye color, with alleles w⁺ for red eye and w for white eye, is located at map position 1.5. A third X-linked gene, controlling bristle form, with f⁺ for normal bristles and f for forked bristles, is located at map position 56.7. At each locus the wild-type allele is dominant over the mutant allele.

Do you expect any of these gene pair(s) to assort independently? Explain your reasoning.

261
views
Textbook Question

In Drosophila, the map positions of genes are given in map units numbering from one end of a chromosome to the other. The X chromosome of Drosophila is 66 m.u. long. The X-linked gene for body color—with two alleles, y⁺ for gray body and y for yellow body—resides at one end of the chromosome at map position 0.0. A nearby locus for eye color, with alleles w⁺ for red eye and w for white eye, is located at map position 1.5. A third X-linked gene, controlling bristle form, with f⁺ for normal bristles and f for forked bristles, is located at map position 56.7. At each locus the wild-type allele is dominant over the mutant allele.

A wild-type female fruit fly with the genotype y⁺w⁺f/ywf⁺ is crossed to a male fruit fly that has yellow body, white eye, and forked bristles. Predict the frequency of each progeny phenotype class produced by this mating.

358
views
Textbook Question

In Drosophila, the map positions of genes are given in map units numbering from one end of a chromosome to the other. The X chromosome of Drosophila is 66 m.u. long. The X-linked gene for body color—with two alleles, y⁺ for gray body and y for yellow body—resides at one end of the chromosome at map position 0.0. A nearby locus for eye color, with alleles w⁺ for red eye and w for white eye, is located at map position 1.5. A third X-linked gene, controlling bristle form, with f⁺ for normal bristles and f for forked bristles, is located at map position 56.7. At each locus the wild-type allele is dominant over the mutant allele.

Explain how each of the predicted progeny classes is produced.

501
views
Textbook Question

The ABO and MN blood groups are shown for four sets of parents (1 to 4) and four children (a to d). Recall that the ABO blood group has three alleles: I^A, I^B and i. The MN blood group has two codominant alleles, M and N. Using your knowledge of these genetic systems, match each child with every set of parents who might have conceived the child, and exclude any parental set that could not have conceived the child. <>

804
views
Textbook Question

The wild-type color of horned beetles is black, although other colors are known. A black horned beetle from a pure-breeding strain is crossed to a pure-breeding green female beetle. All of their F₁ progeny are black. These F₁ are allowed to mate at random with one another, and 320 F₂ beetles are produced. The F₂ consists of 179 black, 81 green, and 60 brown. Use these data to explain the genetics of horned beetle color.

382
views
Textbook Question

Provide a definition and an example for each of the following terms:

additive genes

228
views