A 500.0-mL buffer solution is 0.100 M in HNO2 and 0.150 M in KNO2. Determine if each addition would exceed the capacity of the buffer to neutralize it. d. 1.35 g HI
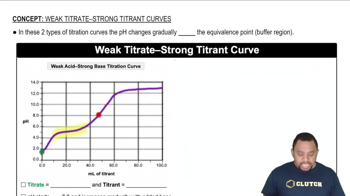
The graphs labeled (a) and (b) show the titration curves for two equal-volume samples of monoprotic acids, one weak and one strong. Both titrations were carried out with the same concentration of strong base.
(ii) Which graph corresponds to the titration of the strong acid and which one to the titration of the weak acid?
 Verified step by step guidance
Verified Solution
Key Concepts
Titration Curves

Strong vs. Weak Acids

Equivalence Point

A 1.0-L buffer solution is 0.125 M in HNO2 and 0.145 M in NaNO2. Determine the concentrations of HNO2 and NaNO2 after the addition of each substance: a. 1.5 g HCl b. 1.5 g NaOH c. 1.5 g HI
The graphs labeled (a) and (b) show the titration curves for two equal-volume samples of monoprotic acids, one weak and one strong. Both titrations were carried out with the same concentration of strong base.
(i) What is the approximate pH at the equivalence point of each curve?
Two 25.0-mL samples, one 0.100 M HCl and the other 0.100 M HF, are titrated with 0.200 M KOH. b. Is the pH at the equivalence point for each titration acidic, basic, or neutral?
Two 25.0-mL samples, one 0.100 M HCl and the other 0.100 M HF, are titrated with 0.200 M KOH. c. Which titration curve has the lower initial pH?
Two 25.0-mL samples, one 0.100 M HCl and the other 0.100 M HF, are titrated with 0.200 M KOH.
d. Sketch each titration curve.
