A portion of a two-dimensional 'slab' of NaCl(s) is shown here (see Figure 8.2) in which the ions are numbered. (a) Which colored balls must represent sodium ions?
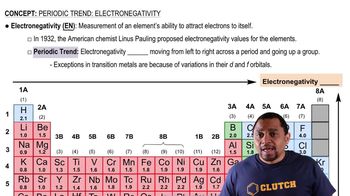
Which of the following charts shows the general periodic trends for the electronegativities of the representative elements? [Section 8.4]

Verified Solution
Key Concepts
Electronegativity

Periodic Trends

Representative Elements

A portion of a two-dimensional 'slab' of NaCl(s) is shown here (see Figure 8.2) in which the ions are numbered. (d) Consider ion 5. How many repulsive interactions are shown for it?
The orbital diagram that follows shows the valence electrons for a 3+ ion of an element. (a) What is the element?
A molecule with formula C4H3NO has the connectivity shown in the figure. After the Lewis structure of the molecule is completed, how many of each of the following are there in the molecule:
a. single bonds,
b. double bonds,
c. triple bonds,
d. nonbonding pairs? [Sections 8.3 and 8.5]
In the Lewis structure shown here, A, D, E, Q, X, and Z represent elements in the first two rows of the periodic table. Identify all six elements so that the formal charges of all atoms are zero.
The molecule shown here is styrene, C8H8, a benzene derivative that is used to make a number of polymers, including polystyrene. The shorthand notation for the benzene ring (described in Section 8.6) is used. Three of the carbon–carbon bonds are numbered in the structure.
a. Which of the three bonds is the strongest?
b. Which of the three bonds is the longest?
c. Which of the three bonds is best described as halfway between a single and a double bond? [Sections 8.6 and 8.8]
