An automotive fuel injector dispenses a fine spray of gasoline into the automobile cylinder, as shown in the bottom drawing here. When an injector gets clogged, as shown in the top drawing, the spray is not as fine or even and the performance of the car declines. How is this observation related to chemical kinetics? [Section 14.1]
Ch.14 - Chemical Kinetics
Chapter 14, Problem 3a
You study the rate of a reaction, measuring both the concentration of the reactant and the concentration of the product as a function of time, and obtain the following results:
![Graph showing concentration of reactant C decreasing and product D increasing over time.](https://lightcat-files.s3.amazonaws.com/problem_images/66b0d9a9ffad3cdf-1666264973446.jpg)
Which chemical equation is consistent with these data: (i) A → B, (ii) B → A, (iii) A → 2 B, (iv) B → 2 A?
![](/channels/images/assetPage/verifiedSolution.png)
Verified Solution
Video duration:
3m![](/channels/images/informationIcon.png)
Was this helpful?
Key Concepts
Here are the essential concepts you must grasp in order to answer the question correctly.
Reaction Rate
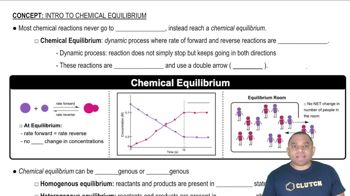
The reaction rate refers to the speed at which reactants are converted into products in a chemical reaction. It is typically expressed as the change in concentration of a reactant or product over time. Understanding how concentration changes over time helps in determining the direction of the reaction and the stoichiometry involved.
Recommended video:
Guided course
Average Rate of Reaction
Chemical Equilibrium
Chemical equilibrium occurs when the rates of the forward and reverse reactions are equal, resulting in constant concentrations of reactants and products. In the context of the provided graph, the concentrations of reactant C decrease while product D increases, indicating a shift towards product formation, which is essential for identifying the correct chemical equation.
Recommended video:
Guided course
Chemical Equilibrium Concepts
Stoichiometry
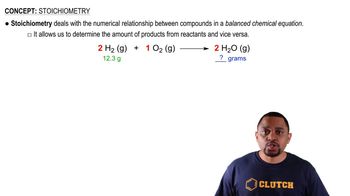
Stoichiometry involves the quantitative relationships between reactants and products in a chemical reaction, as described by the balanced chemical equation. It allows for the prediction of how changes in concentration will affect the amounts of reactants and products, which is crucial for interpreting the data shown in the graph and selecting the appropriate reaction equation.
Recommended video:
Guided course
Stoichiometry Concept
Related Practice
Textbook Question
504
views
Textbook Question
Suppose that for the reaction K+L⟶M, you monitor the production of M over time, and then plot the following graph from your data: b. Is the reaction completed at 𝑡=15 min?
Textbook Question
The following diagrams represent mixtures of NO(g) and O2(𝑔). These two substances react as follows:
2 NO(𝑔)+O2(𝑔)⟶2 NO2(𝑔)
It has been determined experimentally that the rate is second order in NO and first order in O2. Based on this fact, which of the following mixtures will have the fastest initial rate? [Section 14.2]
1
views
Textbook Question
Given the following diagrams at 𝑡=0 min and 𝑡=30 min, b. After four half-life periods for a first-order reaction, what fraction of reactant remains? [Section 14.3]