Here are the essential concepts you must grasp in order to answer the question correctly.
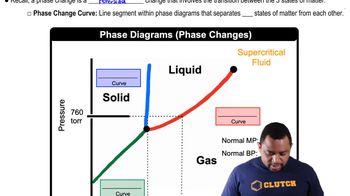
Phase Diagram
A phase diagram is a graphical representation that shows the phases of a substance at various temperatures and pressures. It delineates the boundaries between different states of matter (solid, liquid, gas) and indicates critical points where phase transitions occur. Understanding phase diagrams is essential for analyzing the behavior of substances under varying conditions.
Recommended video:
Phase Changes in Diagrams
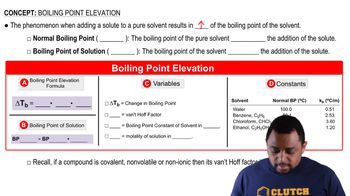
Intermolecular Forces
Intermolecular forces are the attractive forces between molecules that influence their physical properties, such as boiling and melting points. These forces include van der Waals forces, dipole-dipole interactions, and hydrogen bonding. The strength of these forces can be inferred from the critical points of substances, as stronger intermolecular forces typically lead to higher critical temperatures and pressures.
Recommended video:
Intermolecular vs Intramolecular Forces
Critical Point
The critical point of a substance is the temperature and pressure at which the distinction between liquid and gas phases disappears, resulting in a supercritical fluid. At this point, the properties of the liquid and gas phases converge, and the substance can no longer exist as a distinct liquid or gas. Analyzing the critical points of neon and argon helps in comparing their intermolecular forces, as substances with higher critical points generally exhibit stronger intermolecular interactions.
Recommended video:


 03:22
03:22