Textbook Question
Referring to Figure 11.29, describe the phase changes (and the temperatures at which they occur) when CO2 is heated from -80 to -20°C at (a) a constant pressure of 3 atm,
1224
views

 This video solution was recommended by our tutors as helpful for the problem above.
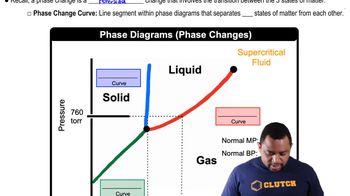
 03:22
03:22 01:46
01:46 04:29
04:29Referring to Figure 11.29, describe the phase changes (and the temperatures at which they occur) when CO2 is heated from -80 to -20°C at (a) a constant pressure of 3 atm,
The phase diagram for neon is
Use the phase diagram to answer the following questions. (a) What is the approximate value of the normal melting point?
Use the phase diagram of neon to answer the following questions. (b) What can you say about the strength of the intermolecular forces in neon and argon based on the critical points of Ne and Ar (see Table 11.5.)?
Indicate whether each statement is true or false: (c) Molecules that exhibit a liquid crystalline phase do so at well-defined temperatures and pressures.
In all four liquid crystalline phases shown in Figure 11.32, the long axis of the molecule preferentially orders along one or more specific directions. In three of the four phases the molecules also lose some freedom of translational motion. In which of the four liquid crystalline phases do the molecules retain the freedom to move in all three directions that they possess in the liquid phase: nematic, smectic A, smectic C, or cholesteric?
As the intermolecular attractive forces between molecules increase in magnitude, do you expect each of the following to increase or decrease in magnitude? (g) critical temperature.